Present live
Invite participants, open responses for each slide, reveal results, and end the session.
1. Check the presentation before starting
Sign in with permission to edit and control the presentation. Review questions, correct answers, slide order, and save status. View-only invitees cannot control presenting, and the editor does not show them the Present button. Hidden slides are skipped unless every slide is hidden, in which case all slides are shown. Keep the slides you intend to present visible.
If email verification is required, check that participants can receive mail. A rehearsal with real participants records responses. Use the editor preview first if you only need to inspect the layout.
2. Start or resume a session
Select Present at the top of the editor. After pending saves finish, the presentation view opens. Opening this view starts a new session or resumes one that is already active.
If starting fails, read the message and select Go to the editor to check the presentation. Startup messages use your selected interface language. Errors without an available explanation show a general startup failure message. If there are no slides, add one in the editor first. This presentation could not be found means the presentation was deleted or is not shared with the account you are signed in to. Only Back to my presentations is offered then, so check the presentation link and your account. If you see View-only access cannot start the presentation, ask the presentation owner for editing permission. Reopening the view does not always create a new session.
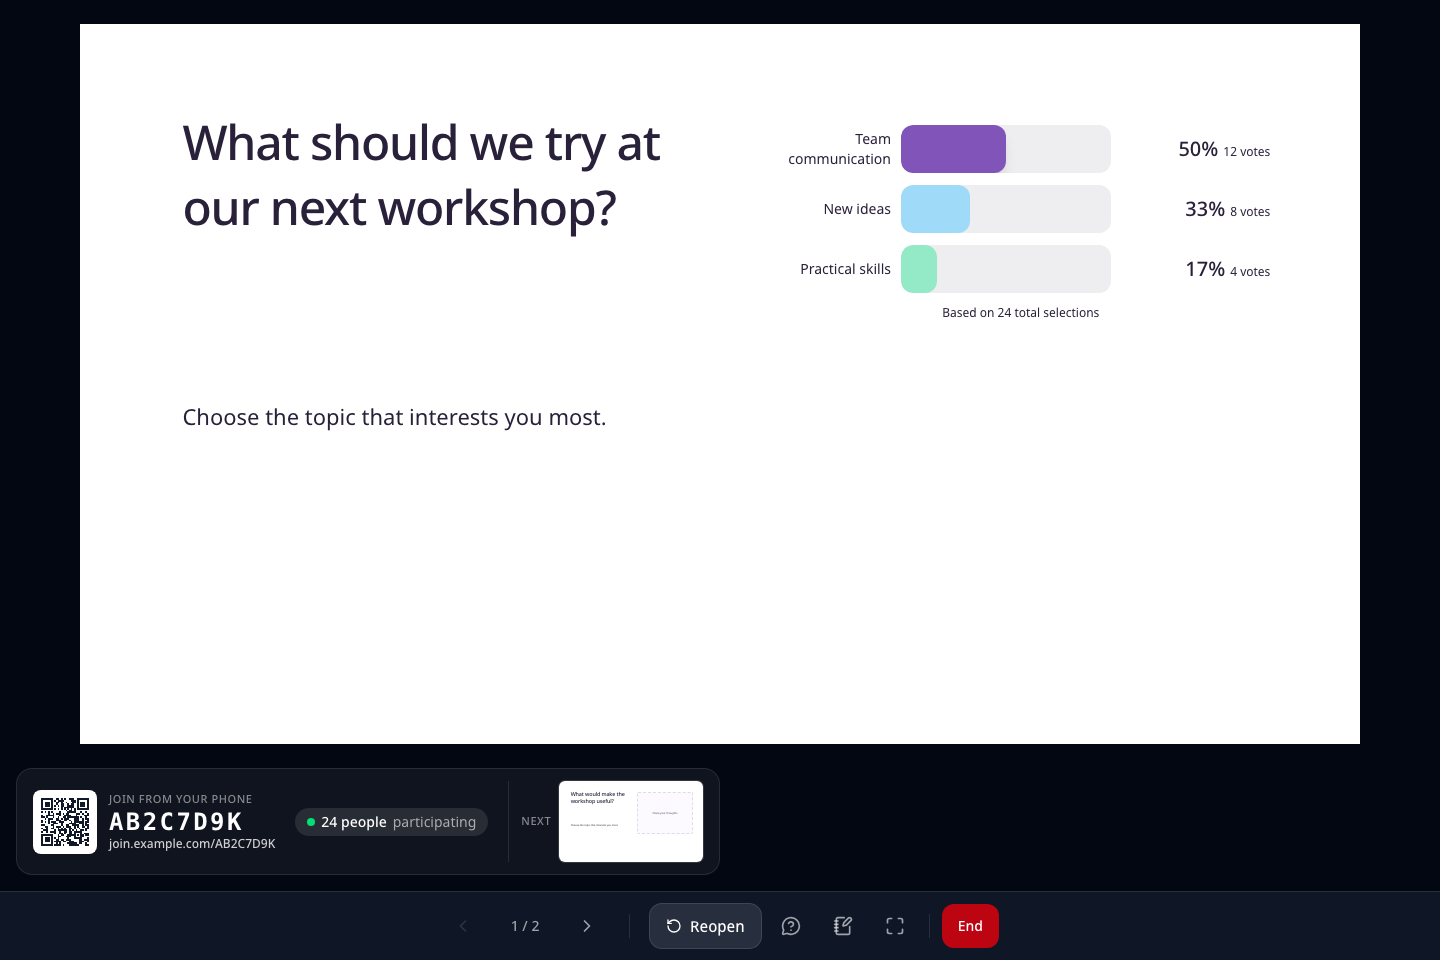
The main area displays the current slide and results. Locate the joining information, slide navigation, and response controls. If the control bar disappears, move the mouse or use the keyboard to reveal it.
3. Share the QR code and join address
Click the small QR code or press Q to enlarge it. Ask participants to scan it or use the displayed join address and access code, then select Back to presenting.
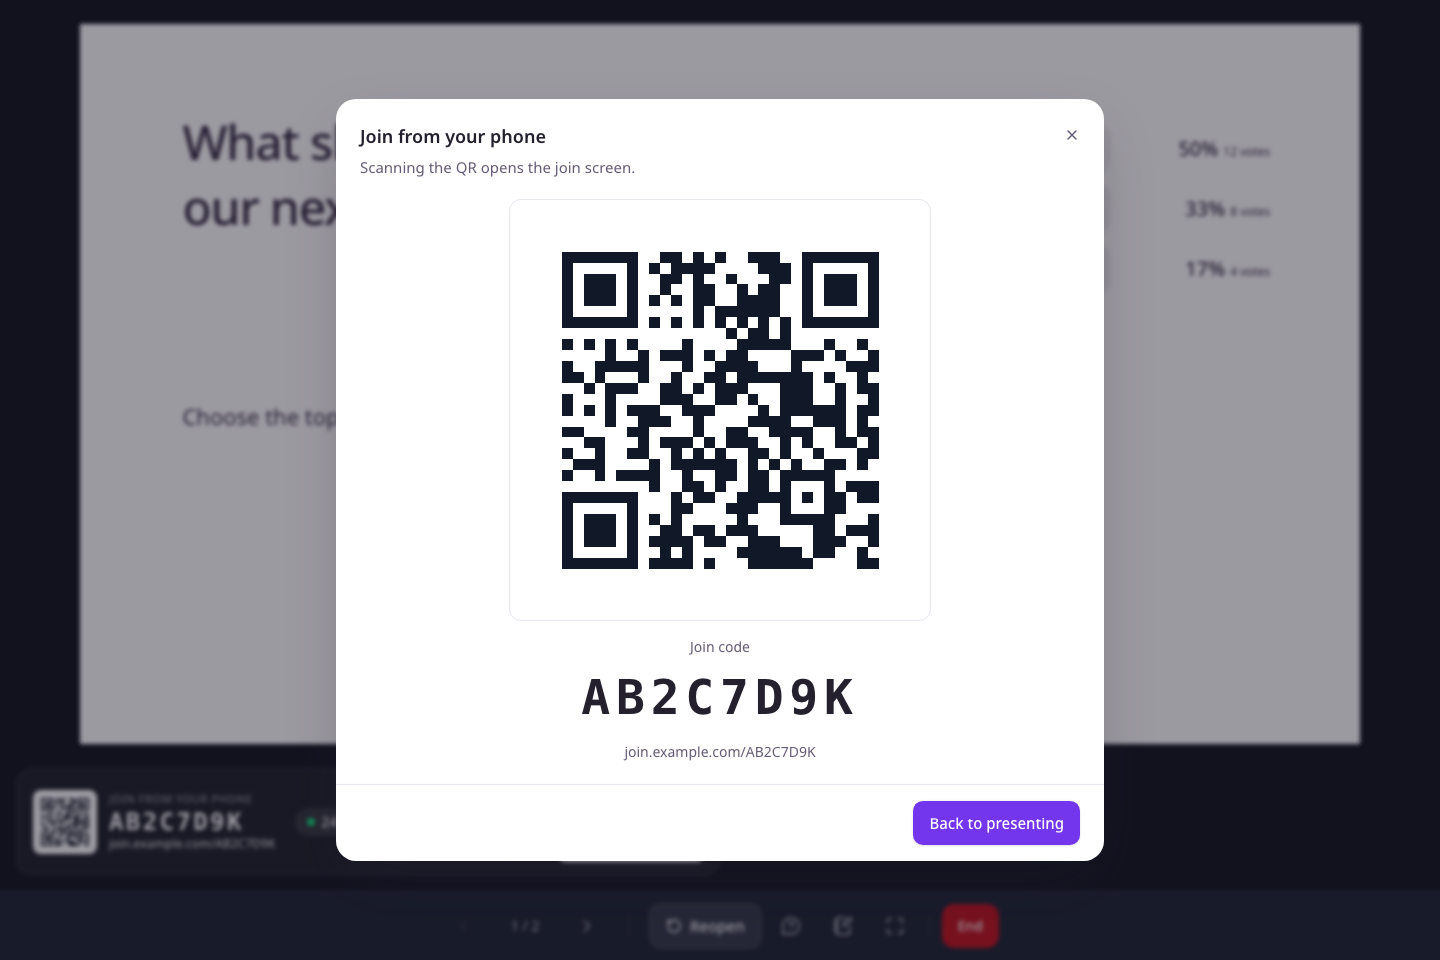
The QR in this example screen uses https://join.example.com. This is a sample address for illustration, not a live presentation join link. To join an actual presentation, use the QR and address the presenter supplies from their current presentation screen.
An access code contains eight uppercase letters and numbers. It excludes 0, O, 1, and I. The editor's share action invites collaborators; use the presentation's join address for your audience. Share the current code on your screen, rather than an example code from this guide.
4. Open responses and show results
Use these controls on answer-submission slides such as polls and quizzes.
| Button | Resulting state | Participant experience |
|---|---|---|
| Open responses | Responses open | Participants can answer the question. |
| Show results | Results displayed | New answers stop being accepted and results are shown. |
| Reopen | Responses open again | Participants who have not answered can submit. |
Show results changes the response state as well as the display. It does not clear submitted poll answers or let everyone vote again. Participant behavior also depends on the question type and any time limit.
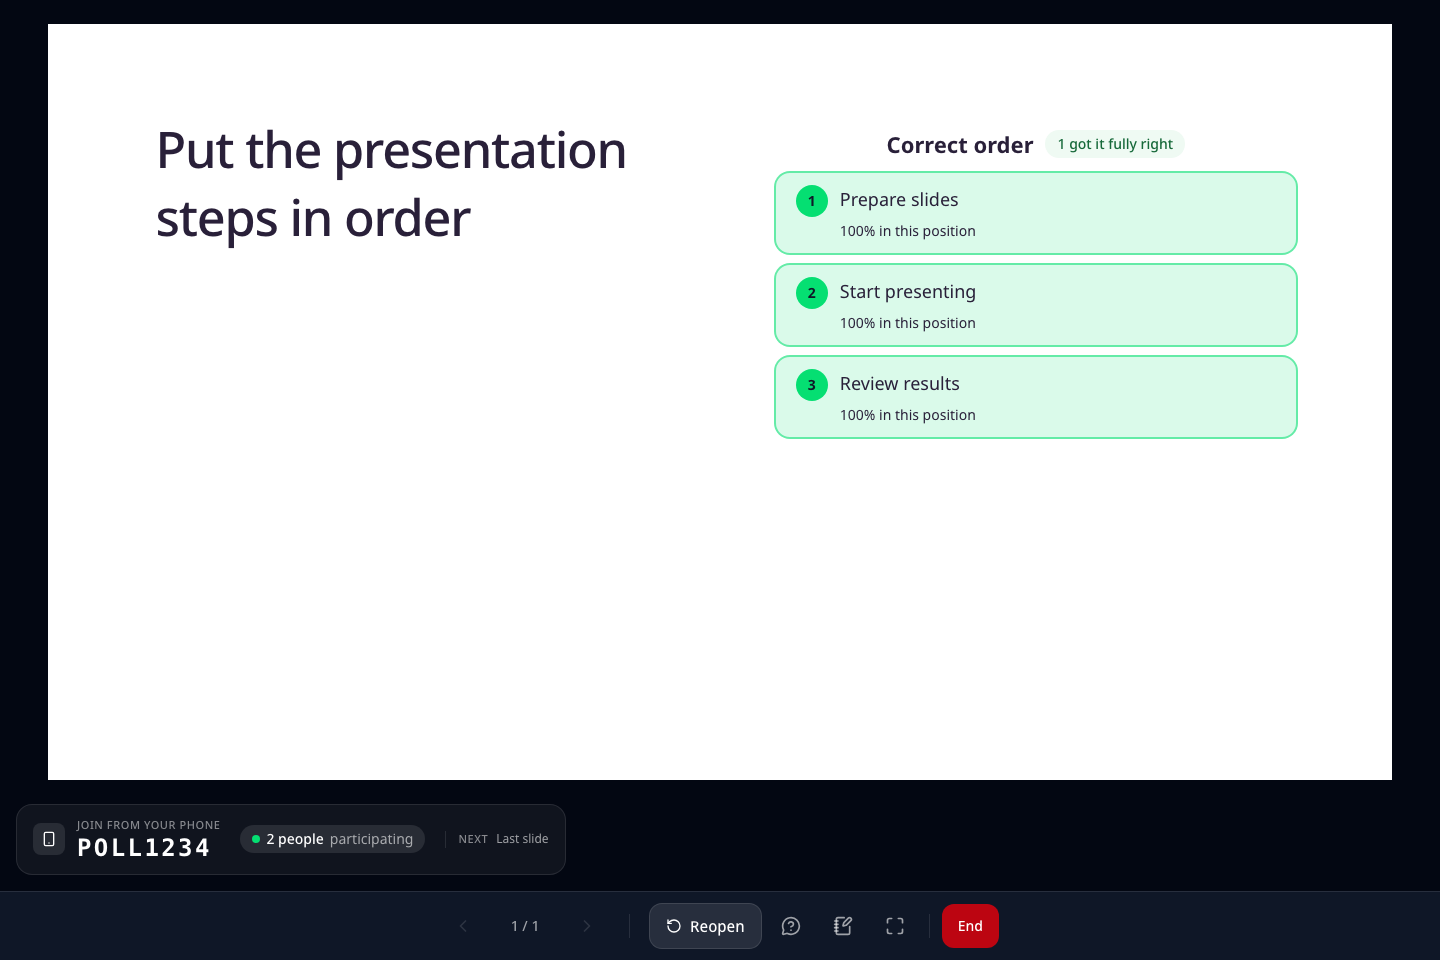
In the presenter results for Correct order and Type answer quizzes, the correct-answer count updates as new answers are saved, without refreshing the page. Select Show results to close responses and review the results together. If the connection drops, reconnect and check the current totals.
Ask the same Pulse question again
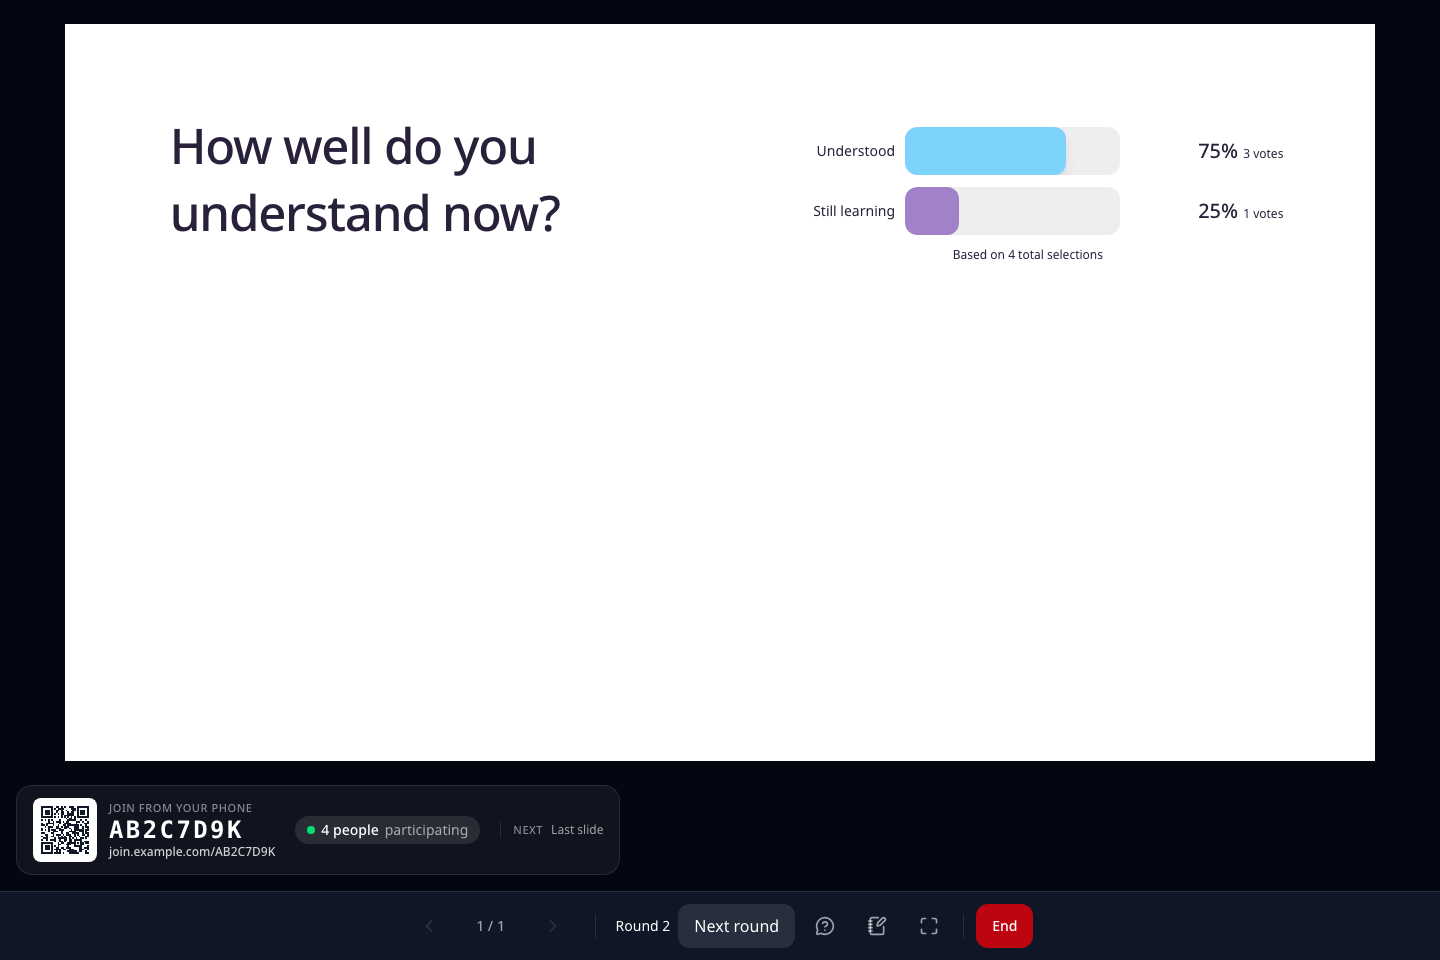
On a Pulse slide, choose Open responses to start the first measurement round. Each participant can answer once per round. After Show results, choose Next round to prepare another round while keeping earlier answers. Check the round number, then choose Open responses to let the same participants answer again.
Revisiting a slide or reconnecting does not create another round. If a next-round request fails, check the displayed round number before retrying. Participants can answer again when the new round appears; a delayed answer from an earlier round is not saved in the new one. Pulse measurement rounds are separate from the presentation's overall sessions. Options cannot be deleted after a Pulse round has been created. Prepare a new slide to change the option set.
5. Move to the next slide
Use the previous and next controls; participant screens follow the current slide. Moving to another slide returns it to a waiting state. Explain the question, then select Open responses. Slides that do not collect answers, such as content slides, have no response control.
These shortcuts may not apply while an input or button has focus or a dialog is open.
| Key | Action |
|---|---|
| Right arrow, Page Down, Space | Next slide |
| Left arrow, Page Up | Previous slide |
| Q | Open the join QR |
| F | Request full screen |
| N | Toggle speaker notes |
Pressing the arrow keys or Next several times in quick succession moves that many slides. While the move is being saved, the slide number at the bottom is highlighted and shows where you will land; participant screens may skip the slides in between and go straight to that slide. If a move fails, the message “Could not move to the next slide” appears and any presses waiting to be applied are cancelled. Check your connection and press again.
6. Use Q&A and speaker notes
While a Q&A slide is showing, the presentation screen shows a prompt, “Send your questions from the join screen”, instead of a question list. Questions are not projected automatically; the presenter reviews them with Q&A.
Select Q&A to review participant questions. Q&A submissions and upvotes work independently of the poll response state. Show results does not close Q&A; ending the presentation stops new questions and upvotes. If question approval is enabled, new questions are not automatically public; use Show again on a hidden question to publish it. Answered marks a question as handled.
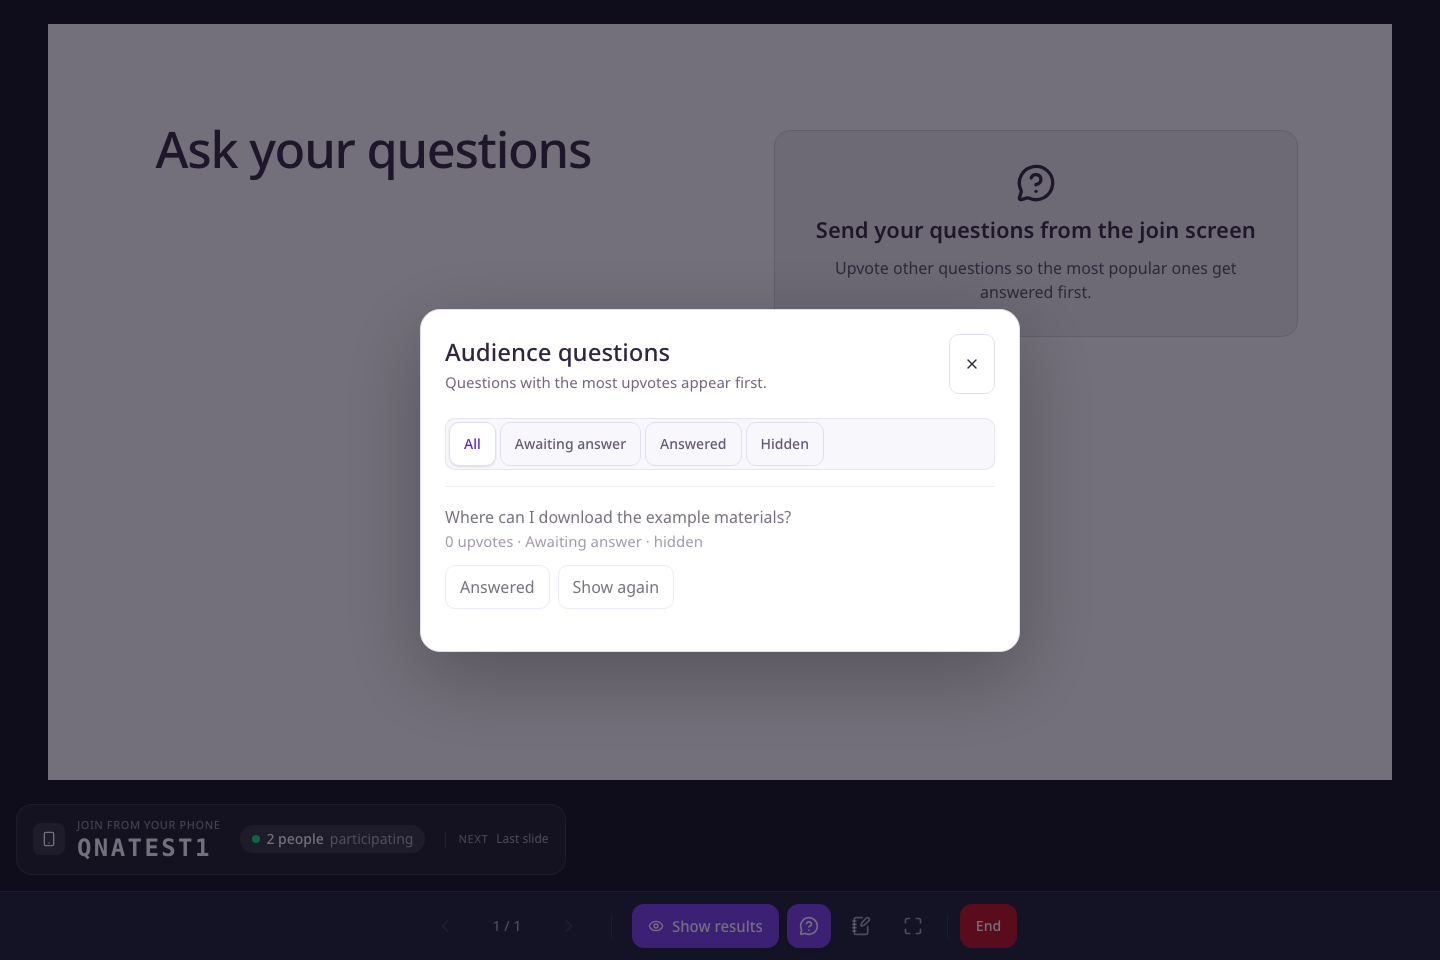
The presentation owner can filter all, waiting, answered, and hidden questions. For example, after explaining where to download the example materials, mark that question Answered. Marking a hidden question answered does not publish it; select Show again to publish it. Hiding it again preserves its answered status. Lists sort by upvotes. The presenter list refreshes about every 3 seconds and the participant list about every 10 seconds, so changes may take a moment to appear. If an error appears, reload the questions or retry the failed action.
Speaker notes open on the current presentation screen. They can be visible to the audience when you share that screen. Do not treat them as a separate private display.
7. Recover from connection or control errors
If slide navigation or a response-state change fails, read the error and retry once the connection recovers. Before asking participants to submit repeatedly, check whether they saw a sent confirmation.
If connection authentication fails, select Sign in again. This notice does not itself end the active session. Check the current slide and response state after returning. If full screen does not open, check your browser's full-screen permissions.
8. End the session and open its report
- Select End.
- Confirm with End presentation, or select Keep presenting to continue.
- Once ending succeeds, responses close, participants see an end notice, and you move to that session's report address. Only the presentation owner can view the detailed report; co-presenters should ask the owner to review the results.
If ending fails, retry rather than assuming it completed. If you remain on the transition screen, select Open report. See Results and reports for the next steps.
Confirm a device connection from the PowerPoint add-in
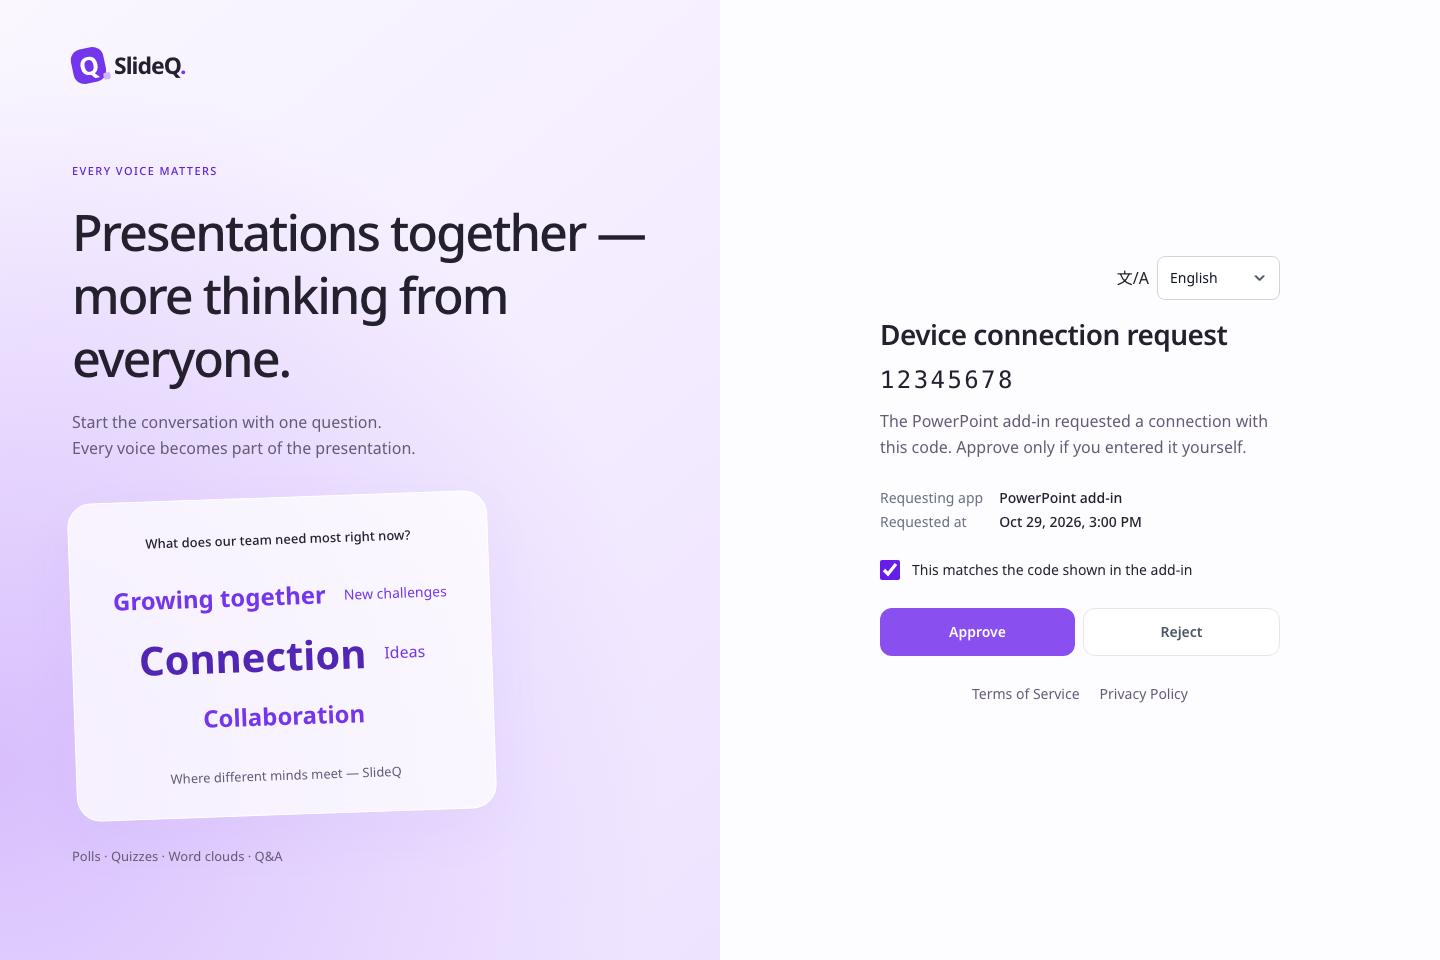
After starting a connection request in the SlideQ add-in, check the Device connection request and code in the browser. The page also shows the Requesting app and Requested at time. Only if you just started the request and the code matches the one in your add-in, check This matches the code shown in the add-in and then select Approve. Approve stays unavailable until you check the box. Select Reject for an unfamiliar request or one with an unexpected time. Changing the display language preserves the connection code.
When Device connection approved appears, return to the SlideQ add-in in PowerPoint. A rejected request does not connect the device. If sign-in is required, select Go to sign-in, then check the code again when you return and choose whether to approve it. Signing in does not automatically approve the request.
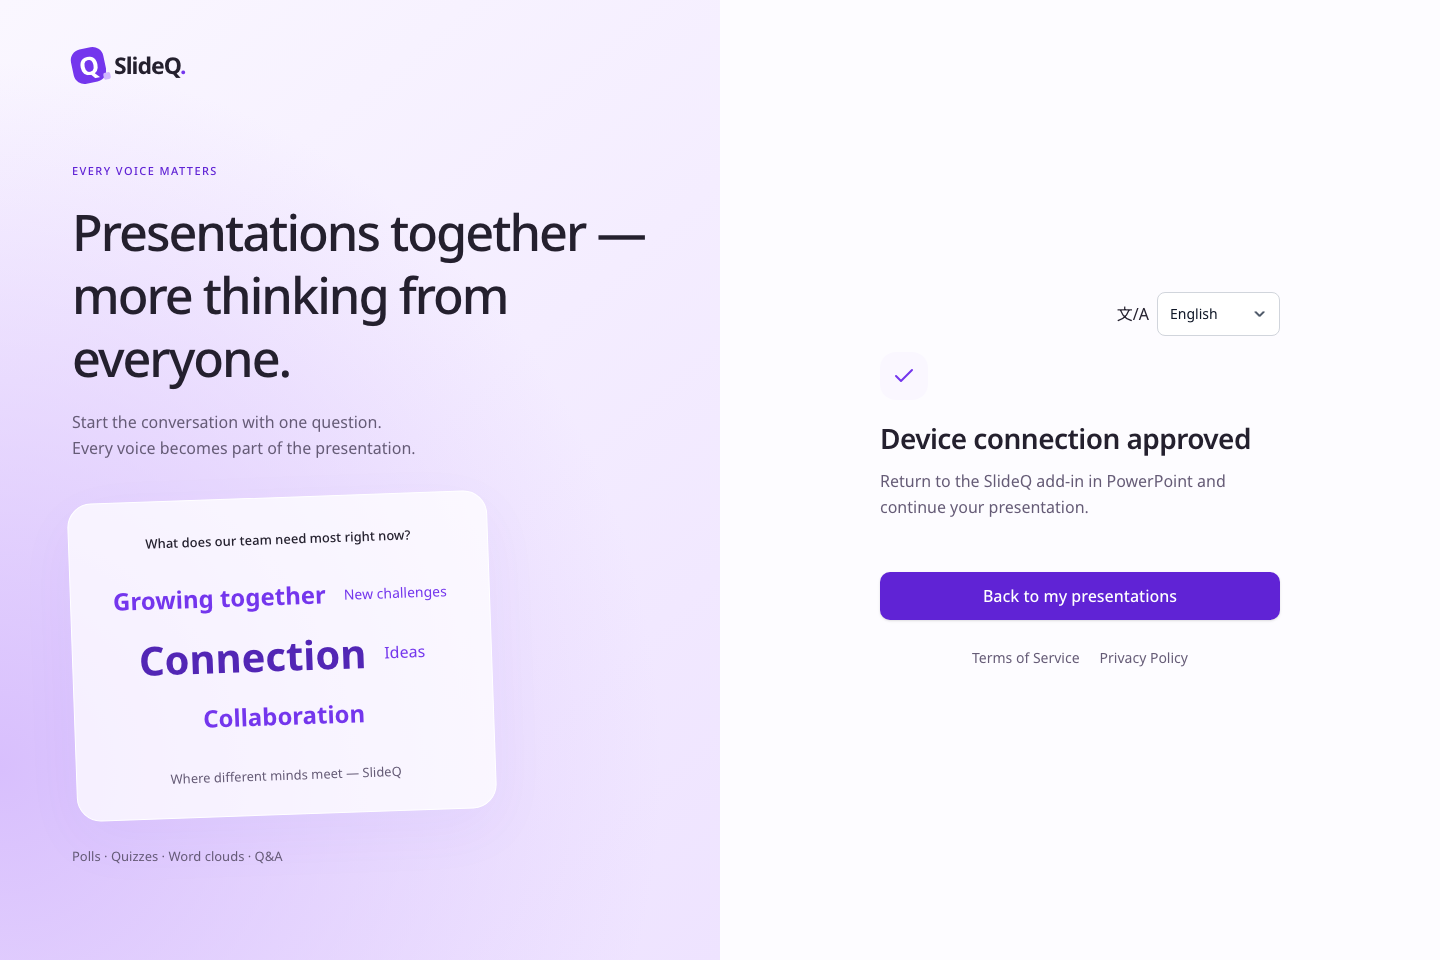
An approved add-in can only load your presentation list and slides, and in the results window show results for a running presentation or hide answers. Account settings, subscription and billing, and editing or deleting presentations are not available through the add-in connection. Sign in to SlideQ on the web for those.
If the request cannot be checked, select Check again. This reads the request again without approving the device. For a missing, expired, or already processed code, start a new request in the add-in. If approving or rejecting fails, read the message and check the request status again.
Read scale results
Collect responses on a scale slide and choose Show results to display the distribution, average and three labels for the current range. For example, answers of 0 and 6 on a 0–8 scale have an average of 3.0.
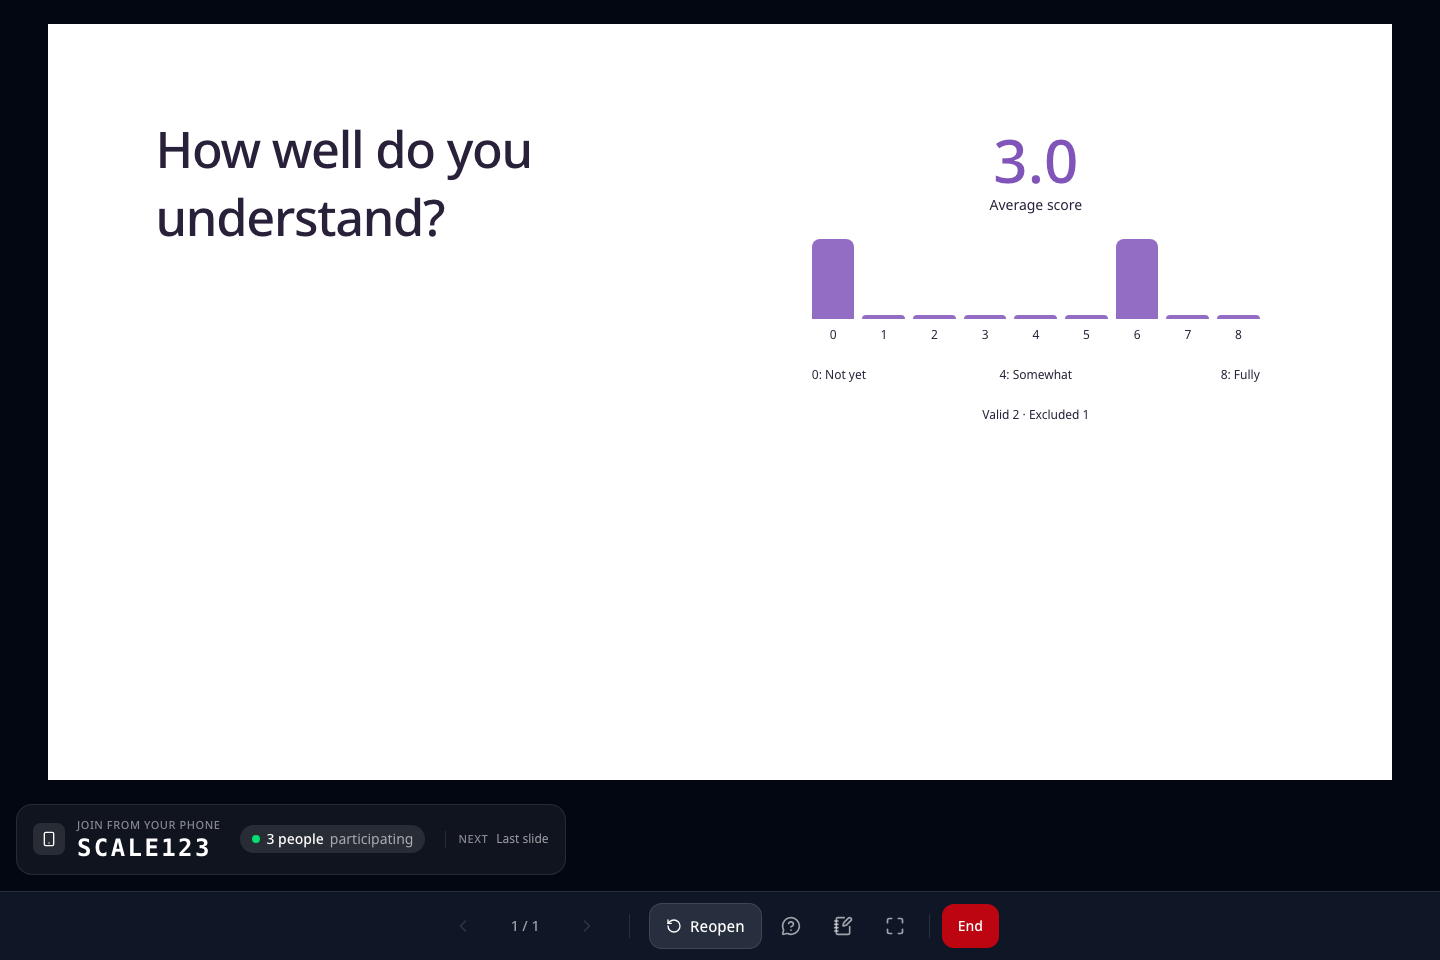
If exclusions appear after a range change, check the current range and CSV in the report. The average is — when there are no valid answers. Earlier answers are neither deleted nor rewritten to fit the new range.
Choose a poll result chart
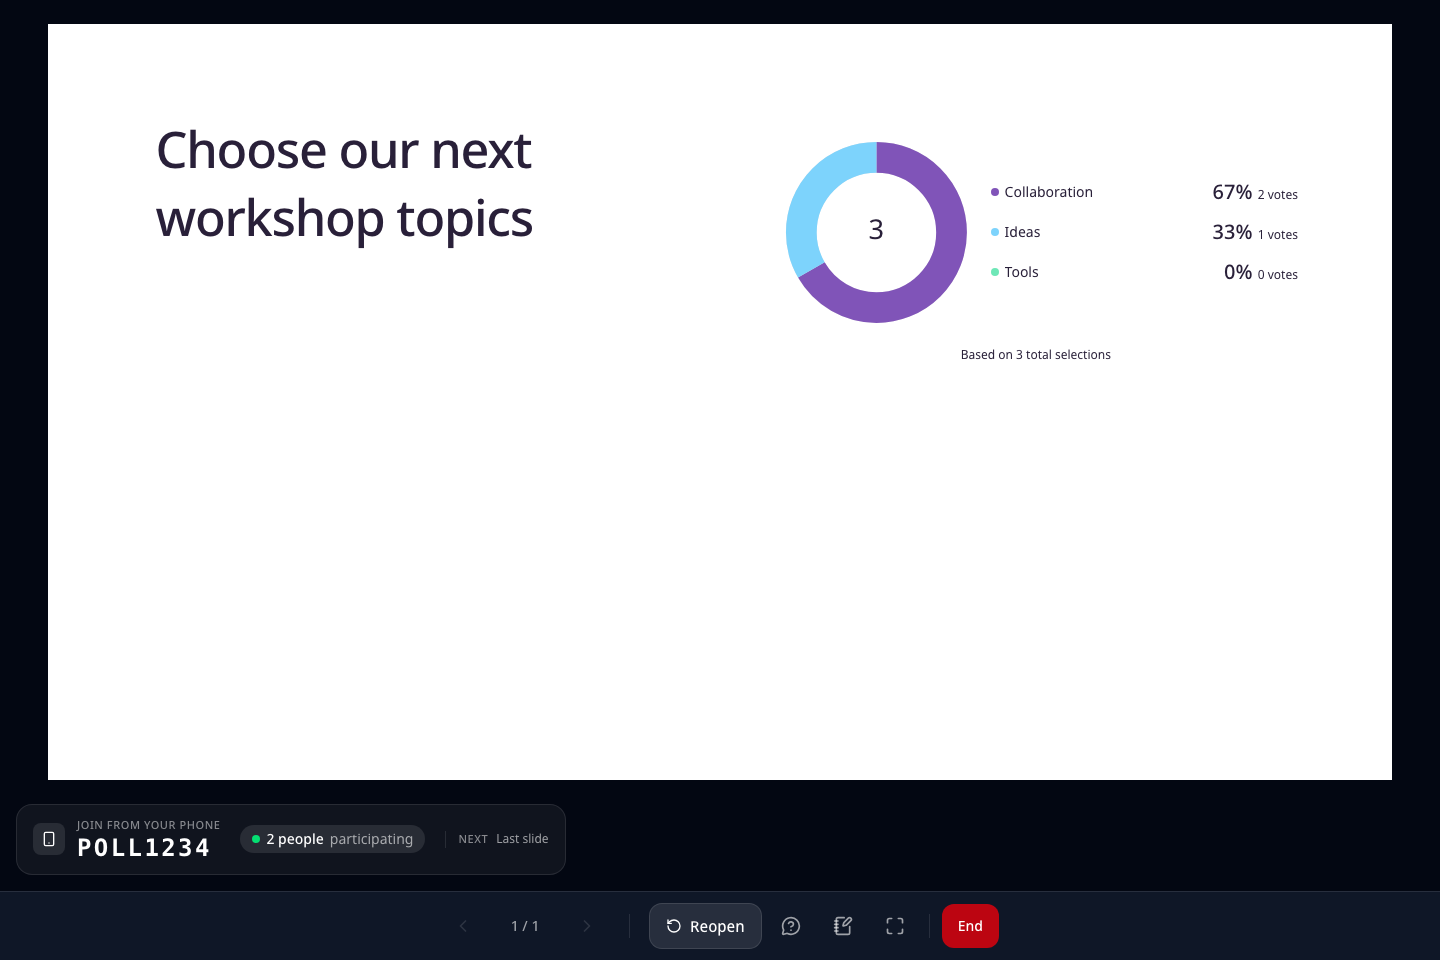
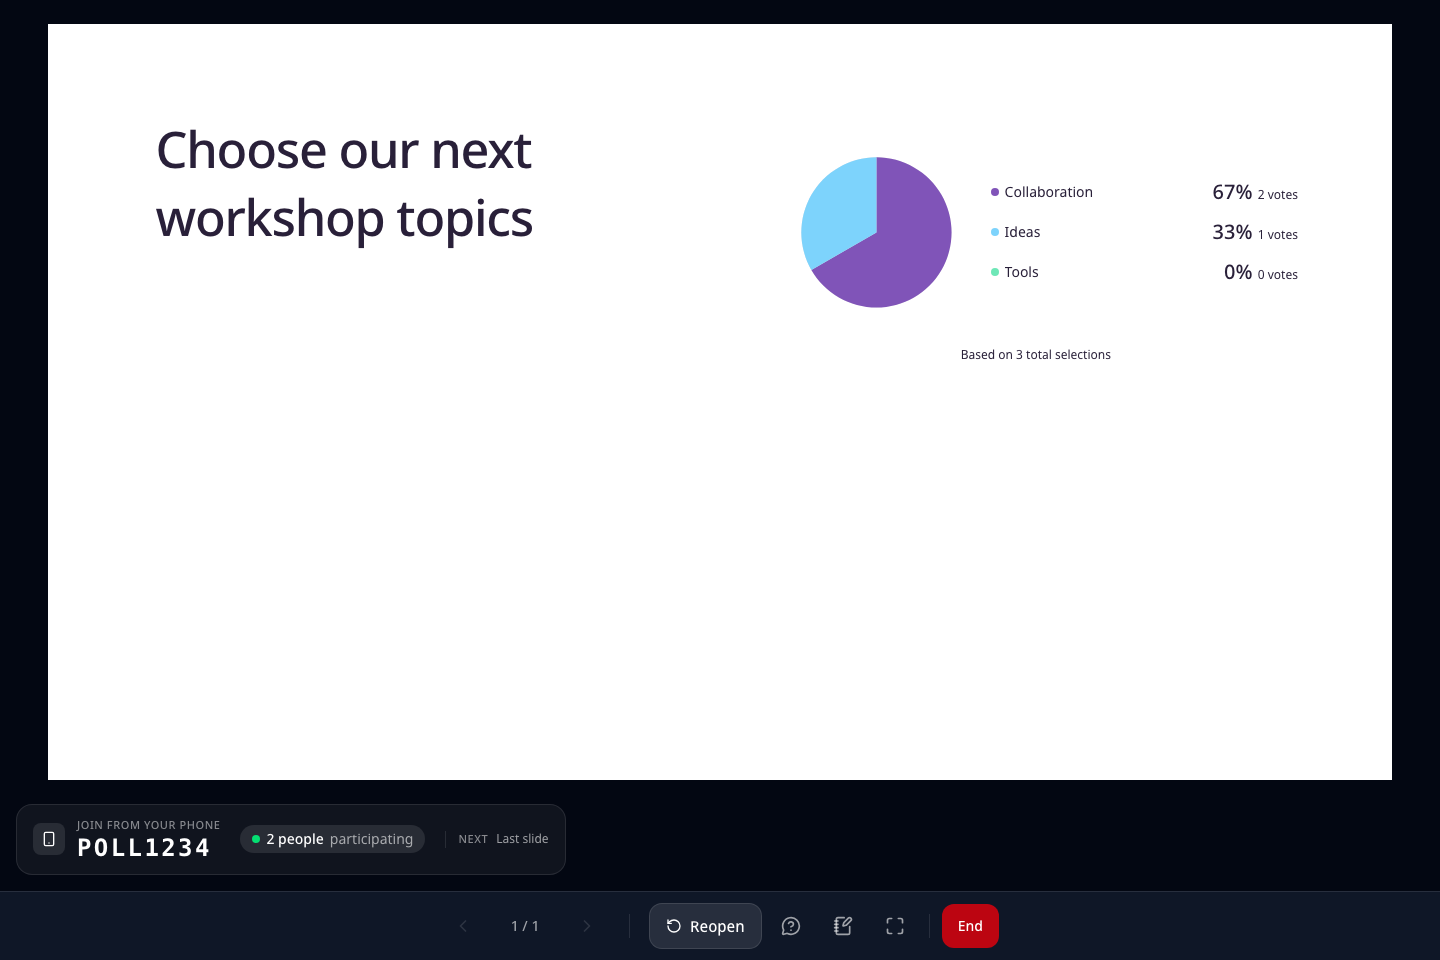
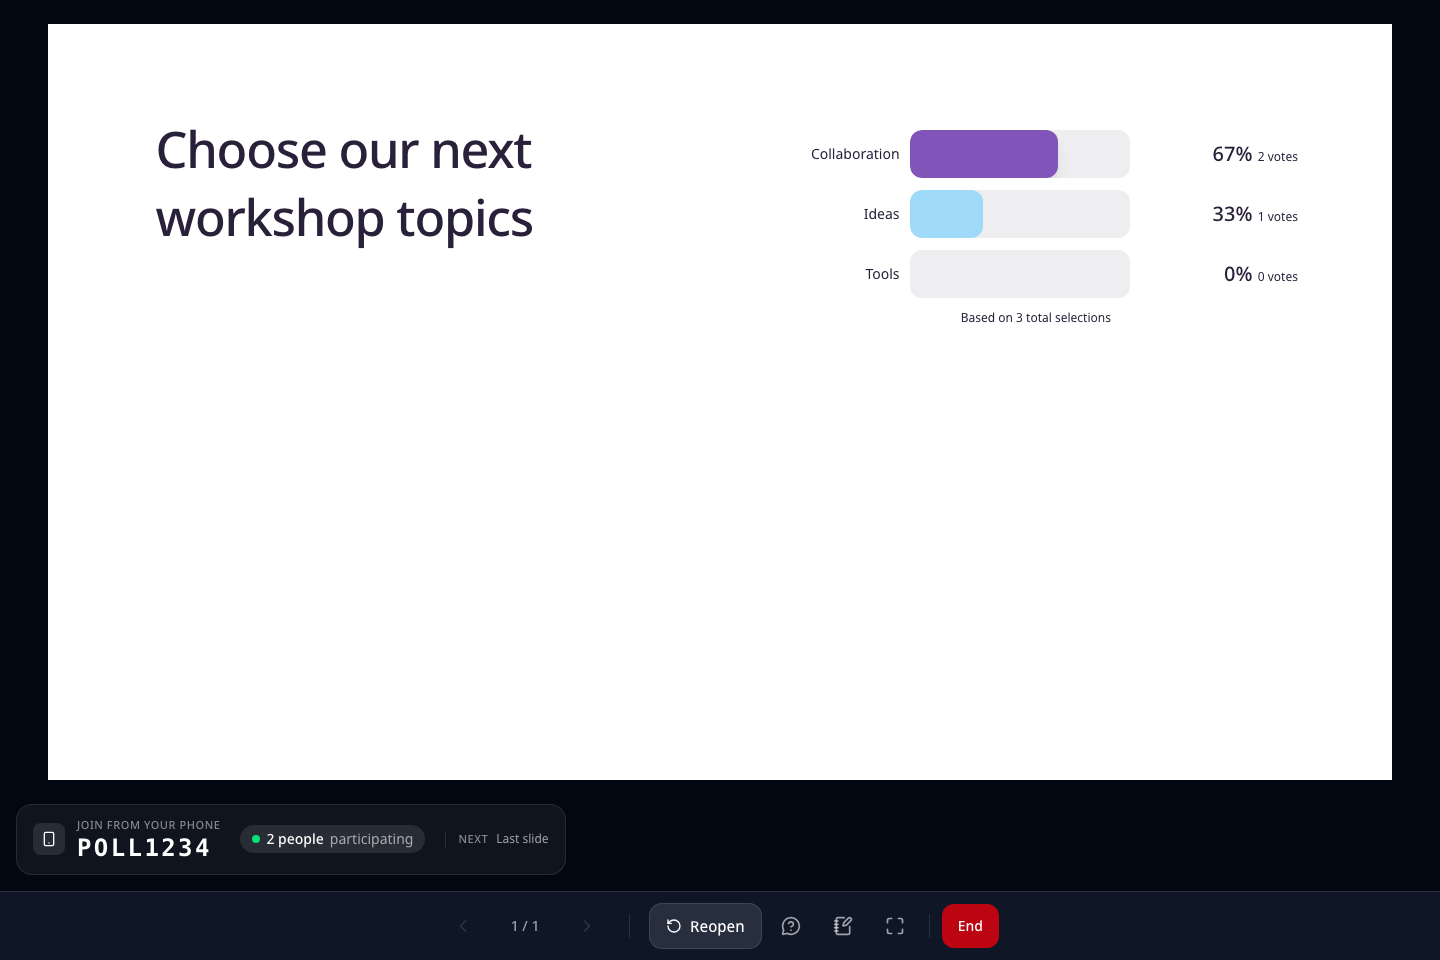
Set the poll's Live result chart in the editor, collect responses during the presentation, then choose Show results. Bar compares counts across choices; Doughnut and Pie show each choice's share of total selections. Pie fills the center of the circle. The chart legend lists every choice with its percentage and vote count.
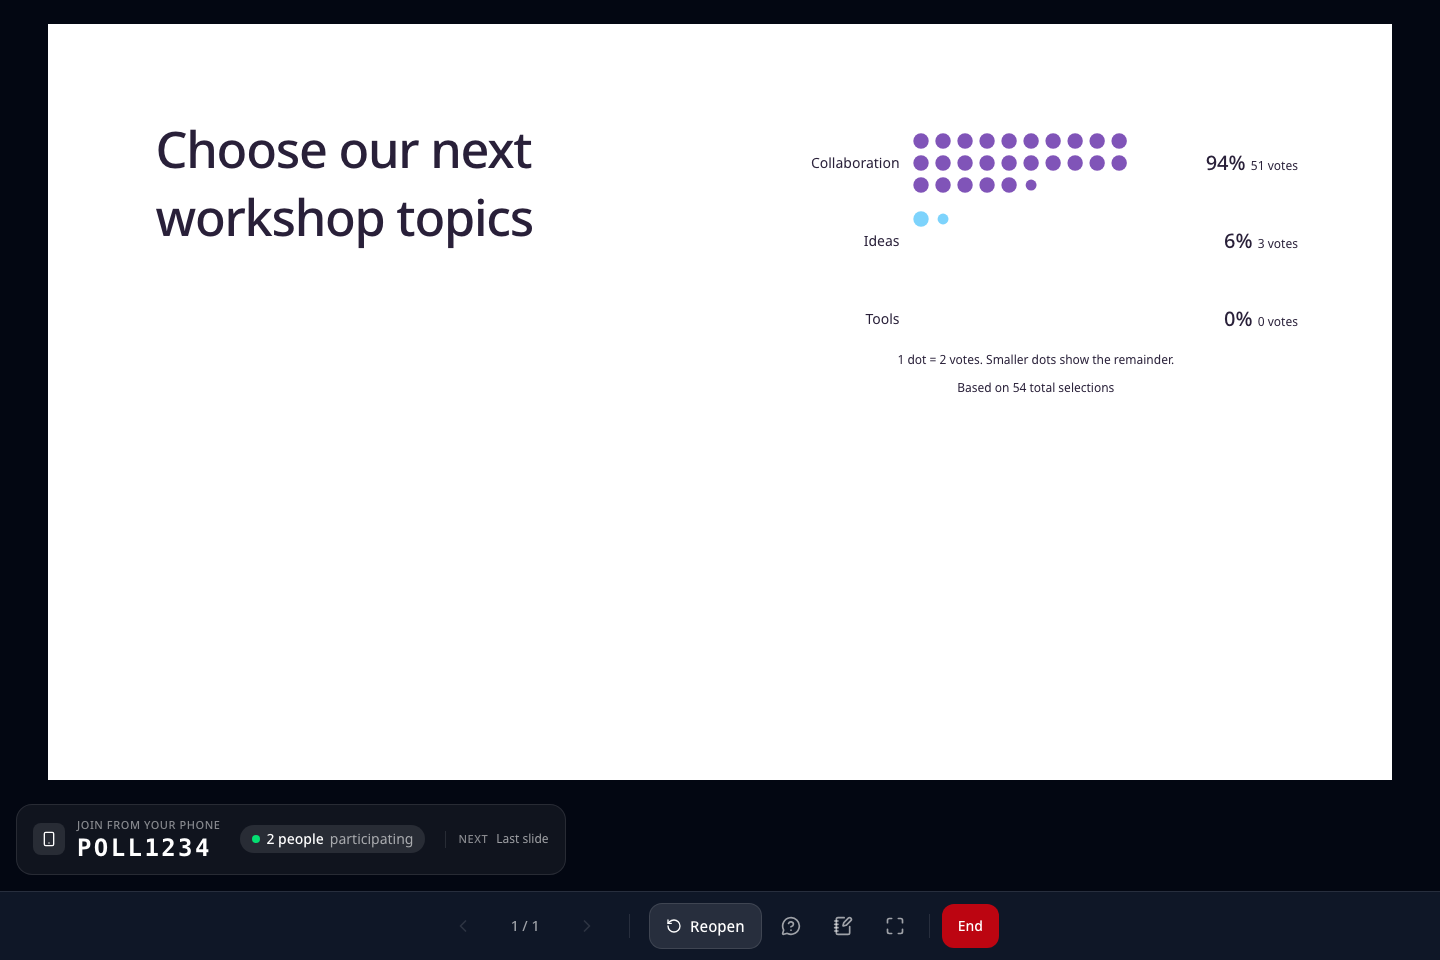
Dots shows each choice’s vote count with dots. Choose Live result chart → Dots in the editor, wait for the saved status, then choose Show results. Each full dot initially represents one vote. For larger counts, a shared unit keeps each choice within 50 dots. The unit appears below the chart; a smaller dot represents the remainder, with its area proportional to that count. For example, at two votes per dot, three votes appear as one full dot and one half-area dot. Incoming votes may change the unit; the adjacent counts and percentages always show the actual totals. If fewer dots appear, check the unit first. Zero-vote choices have no dots.
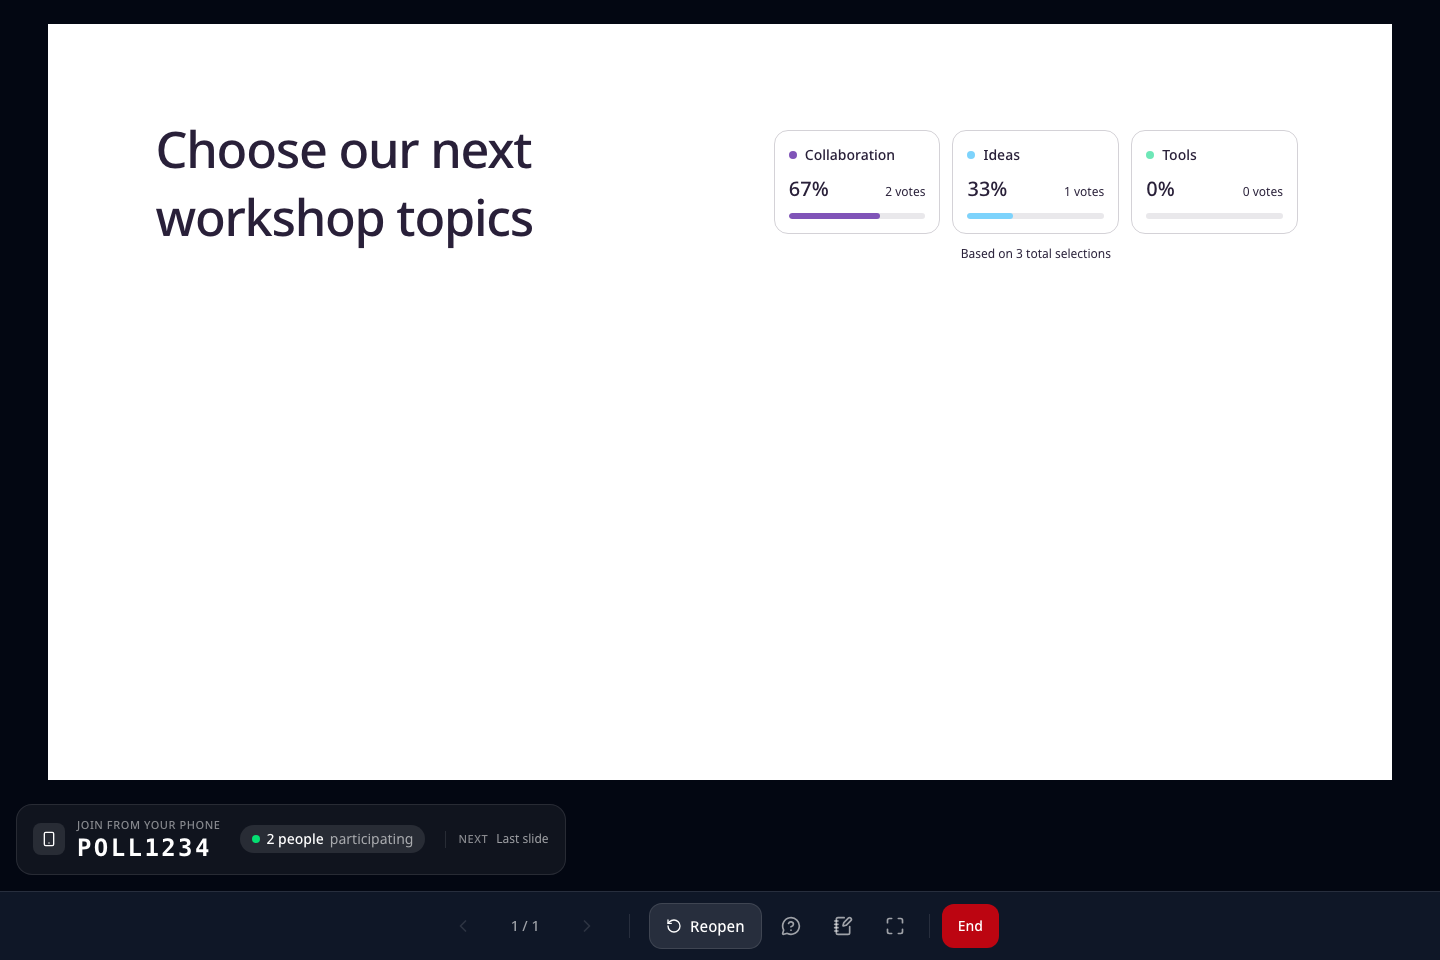
Flowing grid places each choice in an equally sized result card. Choose Live result chart → Flowing grid in the editor, wait for the saved status, then choose Show results. Each card shows the choice label, an image if configured, vote count, percentage, and a small proportion bar. Cards reorder by votes as responses arrive; ties keep the authored order. Narrow screens use fewer columns. Scroll down to read the remaining cards when they extend below the screen. Card size does not represent votes: compare the numbers and bars. Zero-vote cards remain visible, with a waiting message when all counts are zero. If results stop updating, check your connection and reopen the presentation screen.
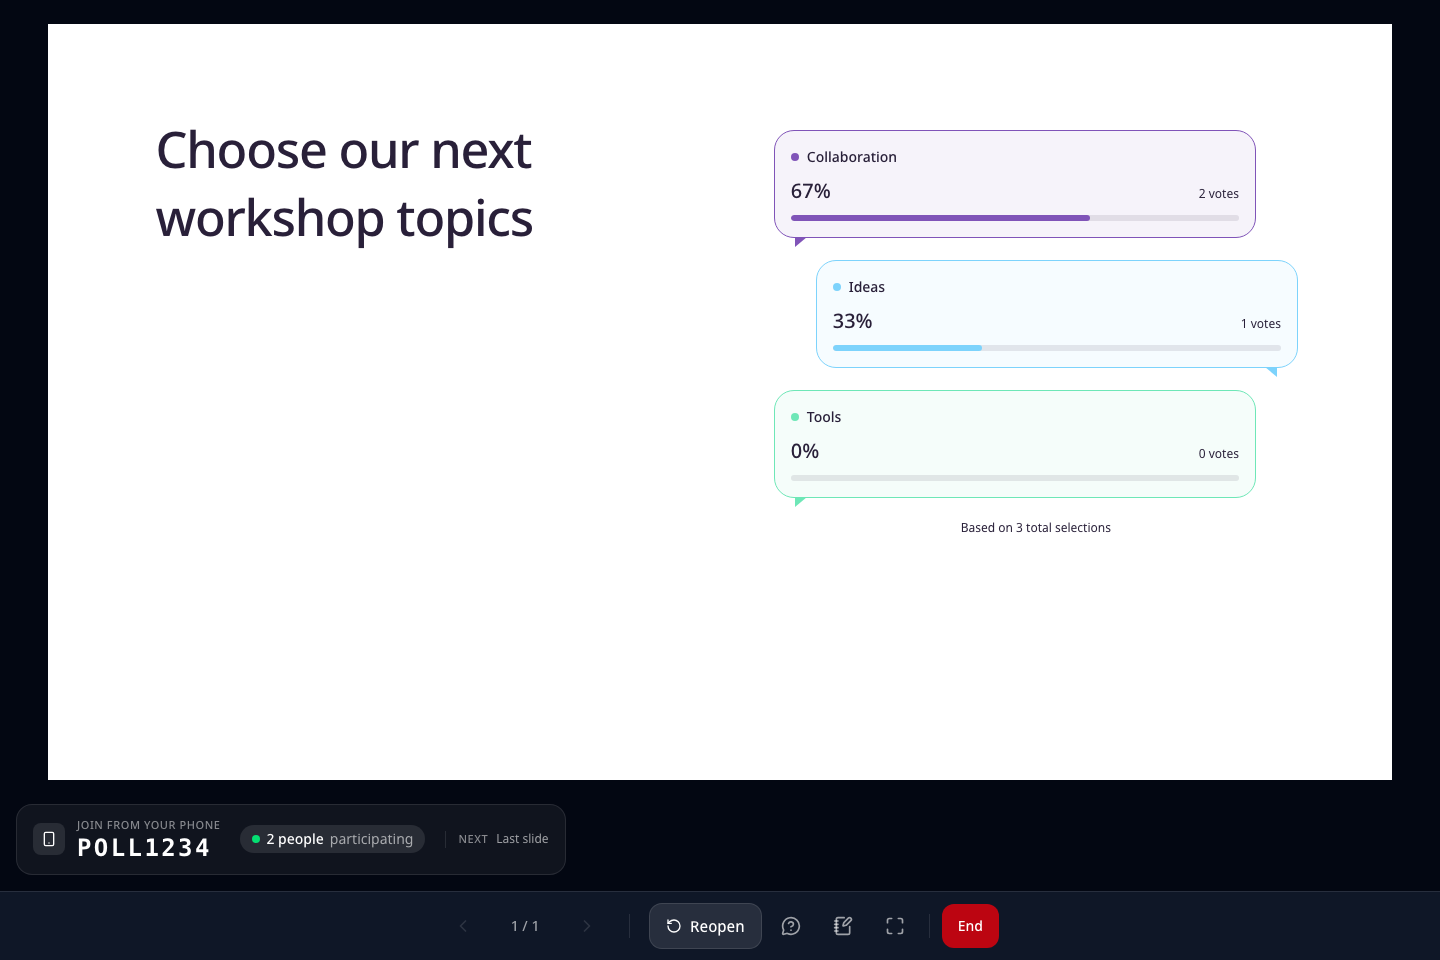
Speech bubbles shows each choice’s aggregated result in a speech bubble. Choose Live result chart → Speech bubbles, wait for the saved status, then choose Show results during the presentation. Each bubble summarizes a choice, not an individual statement. It includes the label, an image if configured, vote count, percentage, and proportion bar. Bubbles update in vote order; colors remain tied to choices and zero-vote choices stay visible. Bubble size and left/right position do not represent vote share or participant identity. Scroll down for longer results. If updates stop, check your connection and reopen the presentation screen.
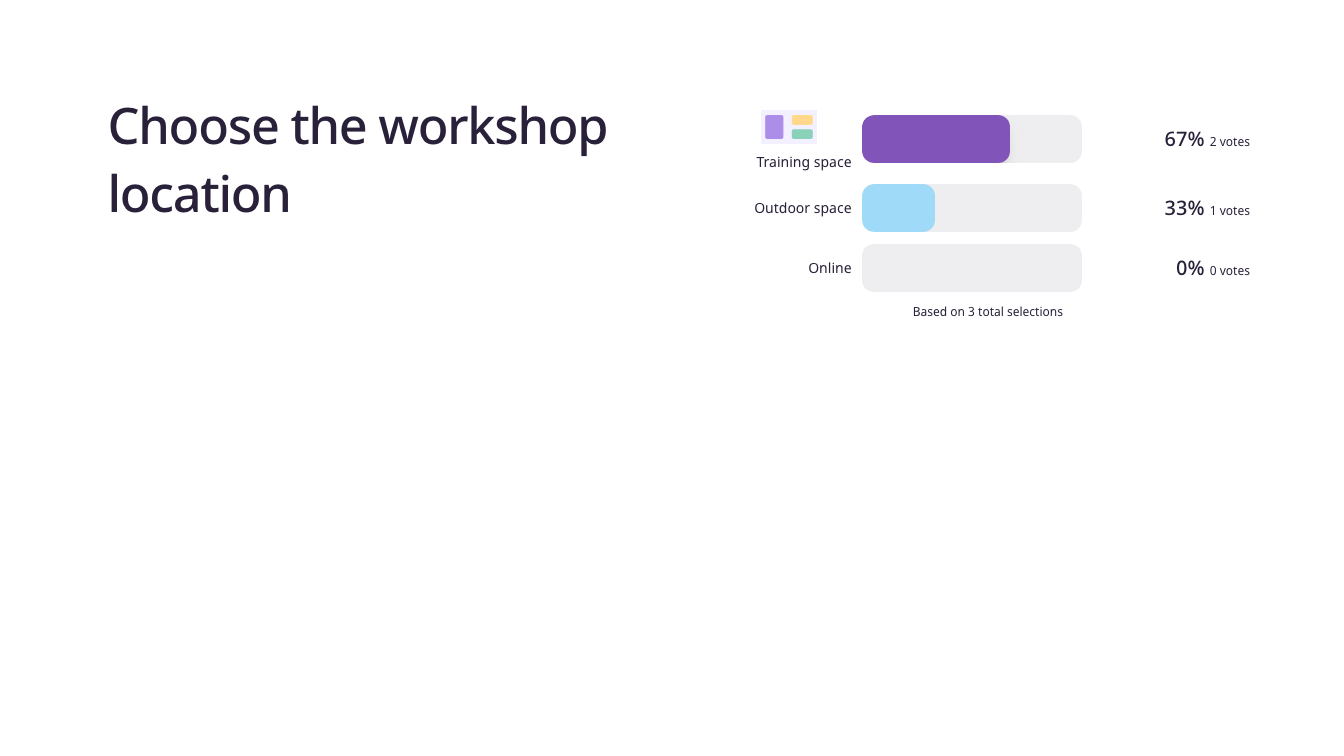
If you added option images, they appear alongside option labels in poll bars, doughnuts, pies, and quiz results. After starting the presentation, check the images and choose Show results to review them with percentages and vote counts. If an image is missing, check your connection, then check the option's image URL or upload status in the editor.
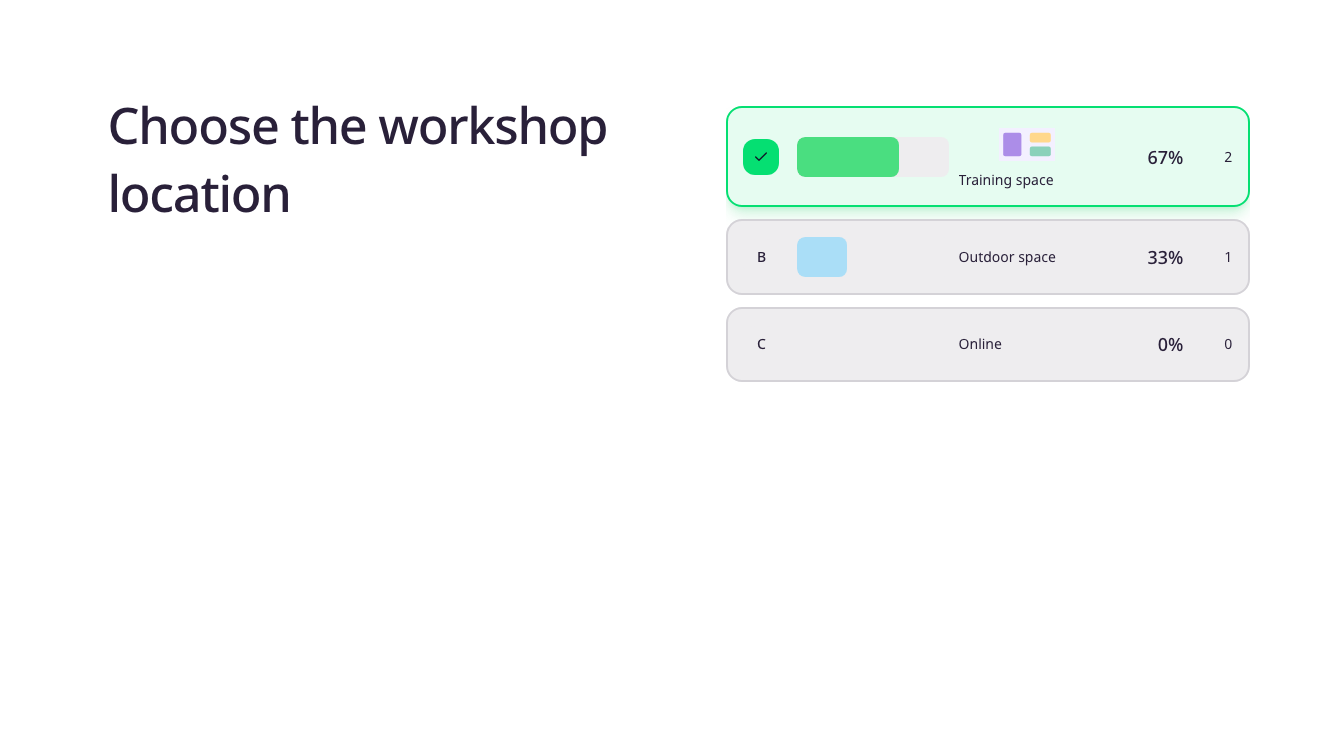
In multiple-selection polls, one person may select several choices. Based on N total selections and the participant count therefore measure different things. If two people make three selections in total, a choice with two votes is shown as 2/3, or 67%. Rounded percentages may add up to 99% or 101%; the doughnut and pie slices use the unrounded proportions.
Results update as new votes arrive. Each choice keeps its color when the ranking changes, and a manually assigned color takes priority. Zero-vote choices remain in the legend. With no votes, an empty ring (Doughnut) or a pale disk (Pie) appears with a waiting message. If percentages seem unexpected, check multiple selection and the total selection count. See reports and CSV for detailed records.
Draw a session participant
Save Session participants as the spinner's Draw source, then navigate to that slide during the presentation. After people join, choose Spin the wheel. The server fixes the candidate list and winner at that moment and displays the result. Participant mode does not determine the winner from a wheel's stopping position.
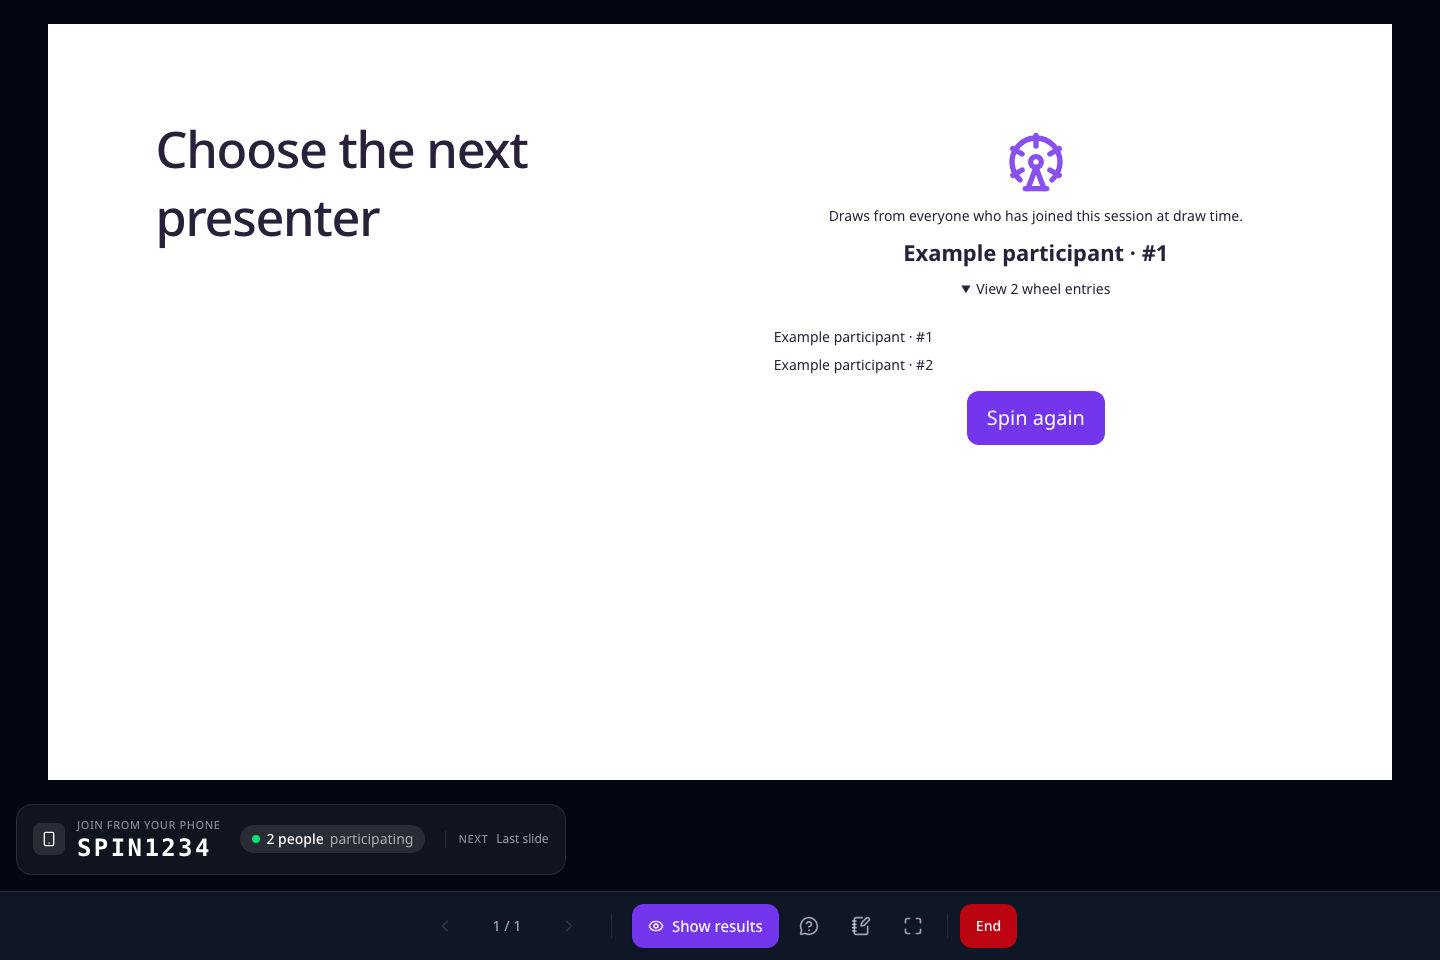
Check the winner's name and number, and expand View N wheel entries to inspect the candidate list. Spin again starts a new draw. A single eligible candidate wins automatically; no new result is created if there are no candidates or all are excluded. Wait for someone to join or adjust exclusion as appropriate.
If delivery fails, choose Check the same draw again. A pending request survives a refresh in the same tab, so confirming it does not draw a new winner. Another tab or a reconnected presenter can also retrieve the latest saved result and candidates. Choose Spin again only when you want a new draw. This restoration applies to Session participants mode; Manual entries retains its existing wheel animation and result delivery.
Review idea upvotes
After collecting responses on a brainstorming slide, review the ideas and their upvote counts. For example, an idea with three votes displays 3 on its card. The board displays ideas in descending vote order. Repeated votes from the same participant do not add another vote to an idea.
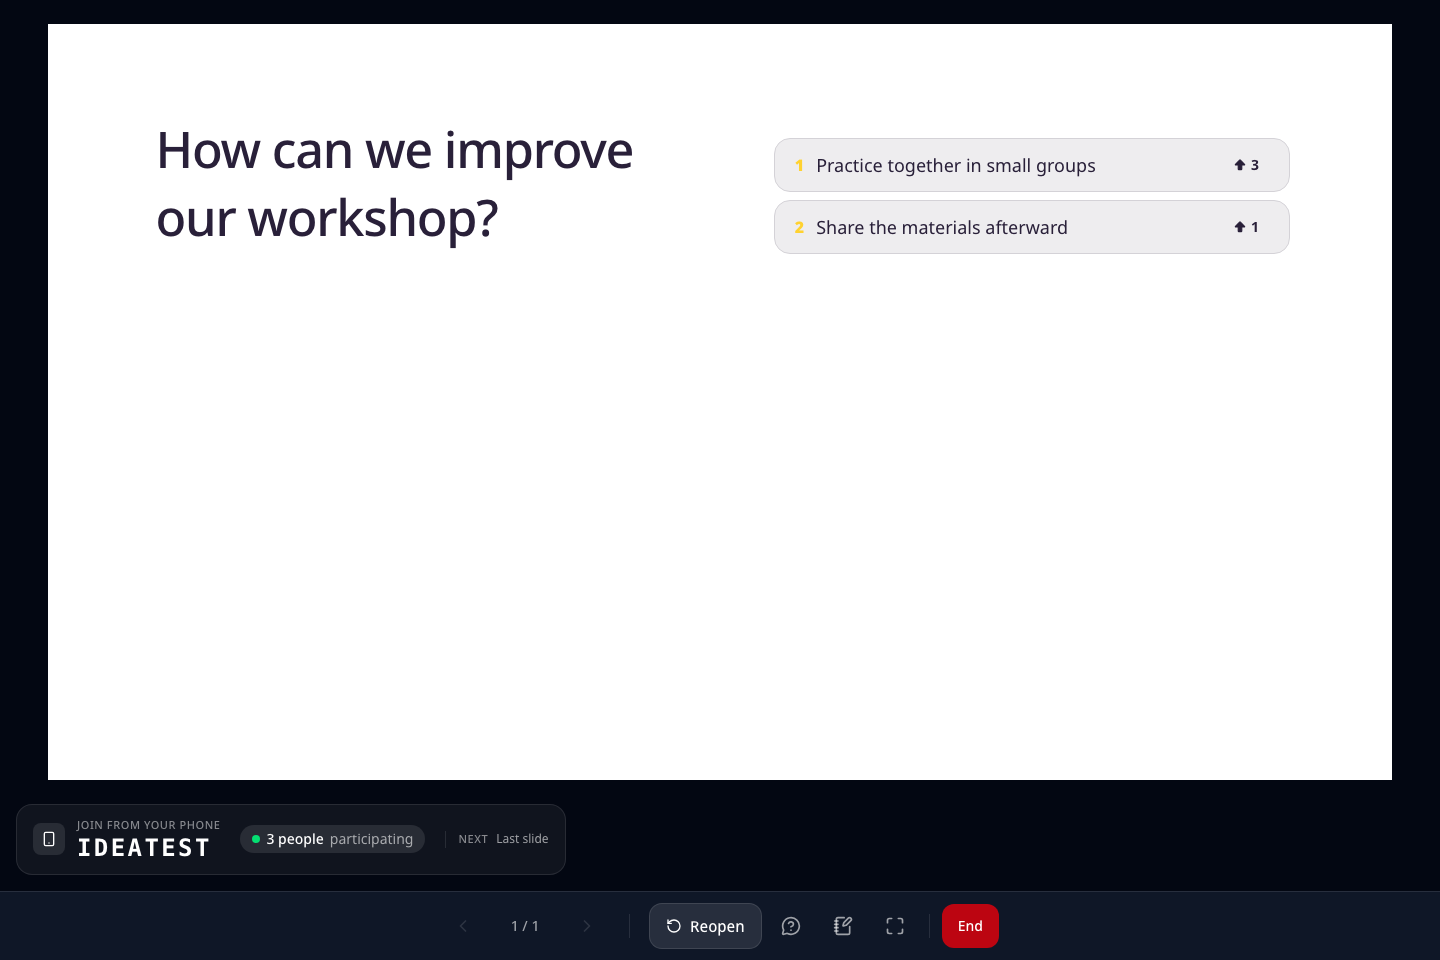
New ideas appear on the board as soon as they are submitted. If updates are delayed, check your connection and wait for the list to refresh. Refreshing the page or reconnecting still shows the saved vote counts.
You can hide inappropriate ideas.
- With a mouse, point to the card you want to hide. On touch screens, the button is always visible.
- Select Hide idea (✕) in the top-right corner of the card.
- Check that the card disappears immediately from the presenter view and the result frame. It does not return after a refresh.
Hidden ideas are removed from the participant list, new votes and the report's ideas board. Hiding cannot be undone, and the CSV keeps the original response. If hiding fails, the card reappears on the board. Check your connection and select the same button again.
View open-ended answers as a list, grid, or speech bubbles
Save the ordinary open-ended slide’s Live result chart in the editor, then start presenting and collect responses. List stacks answers vertically, Flowing grid uses columns that fit the available width, and Speech bubbles alternates answers left and right. Existing slides use List. Changing the layout preserves answer content, display order, and input limits. New answers appear first.
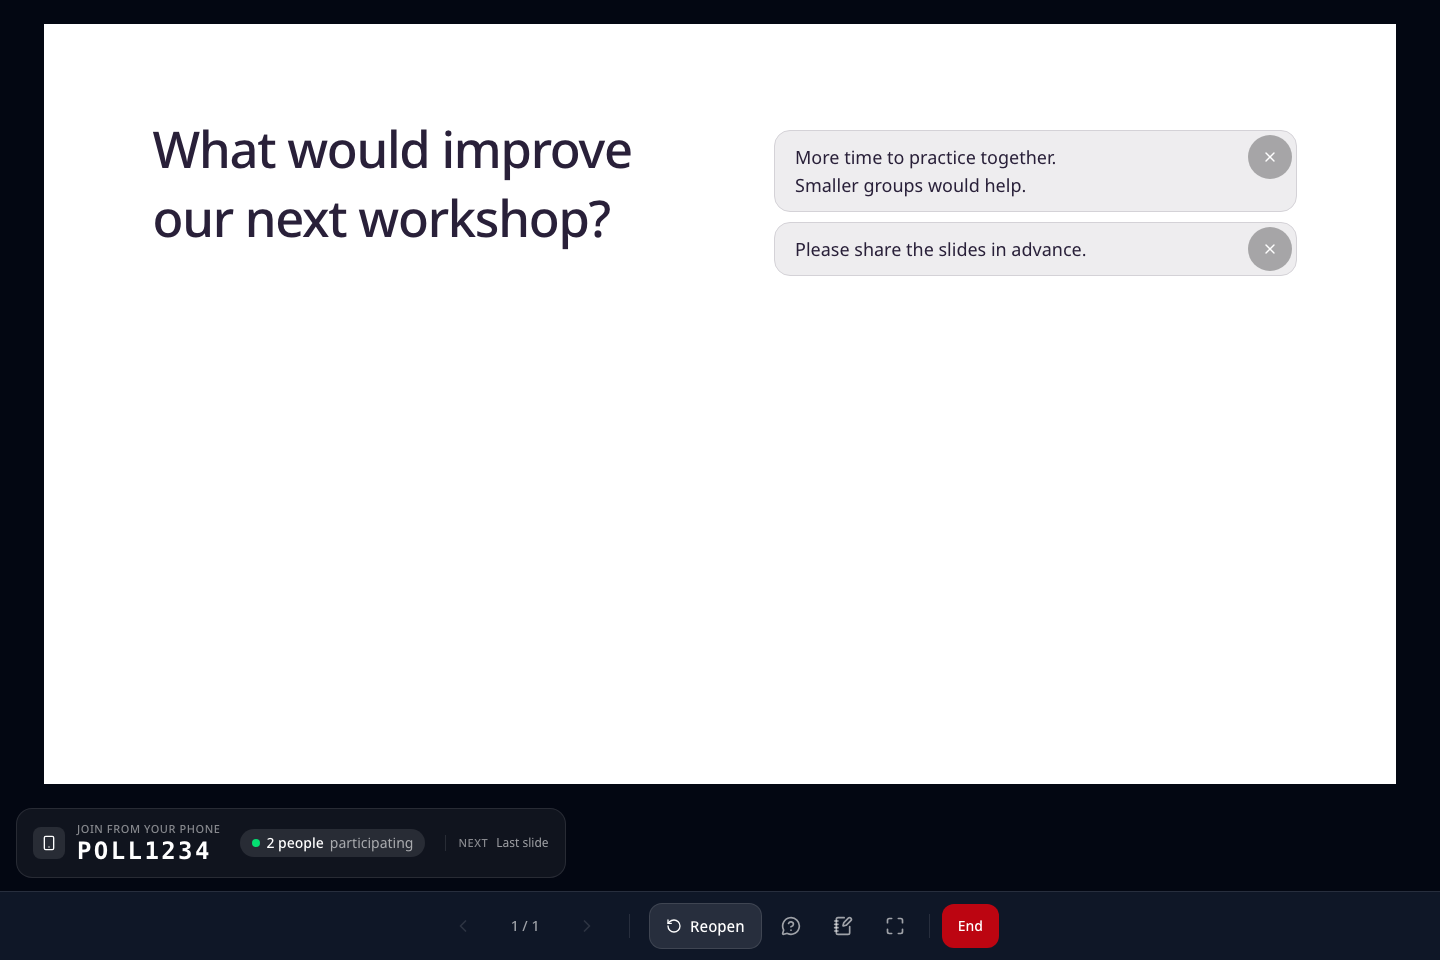
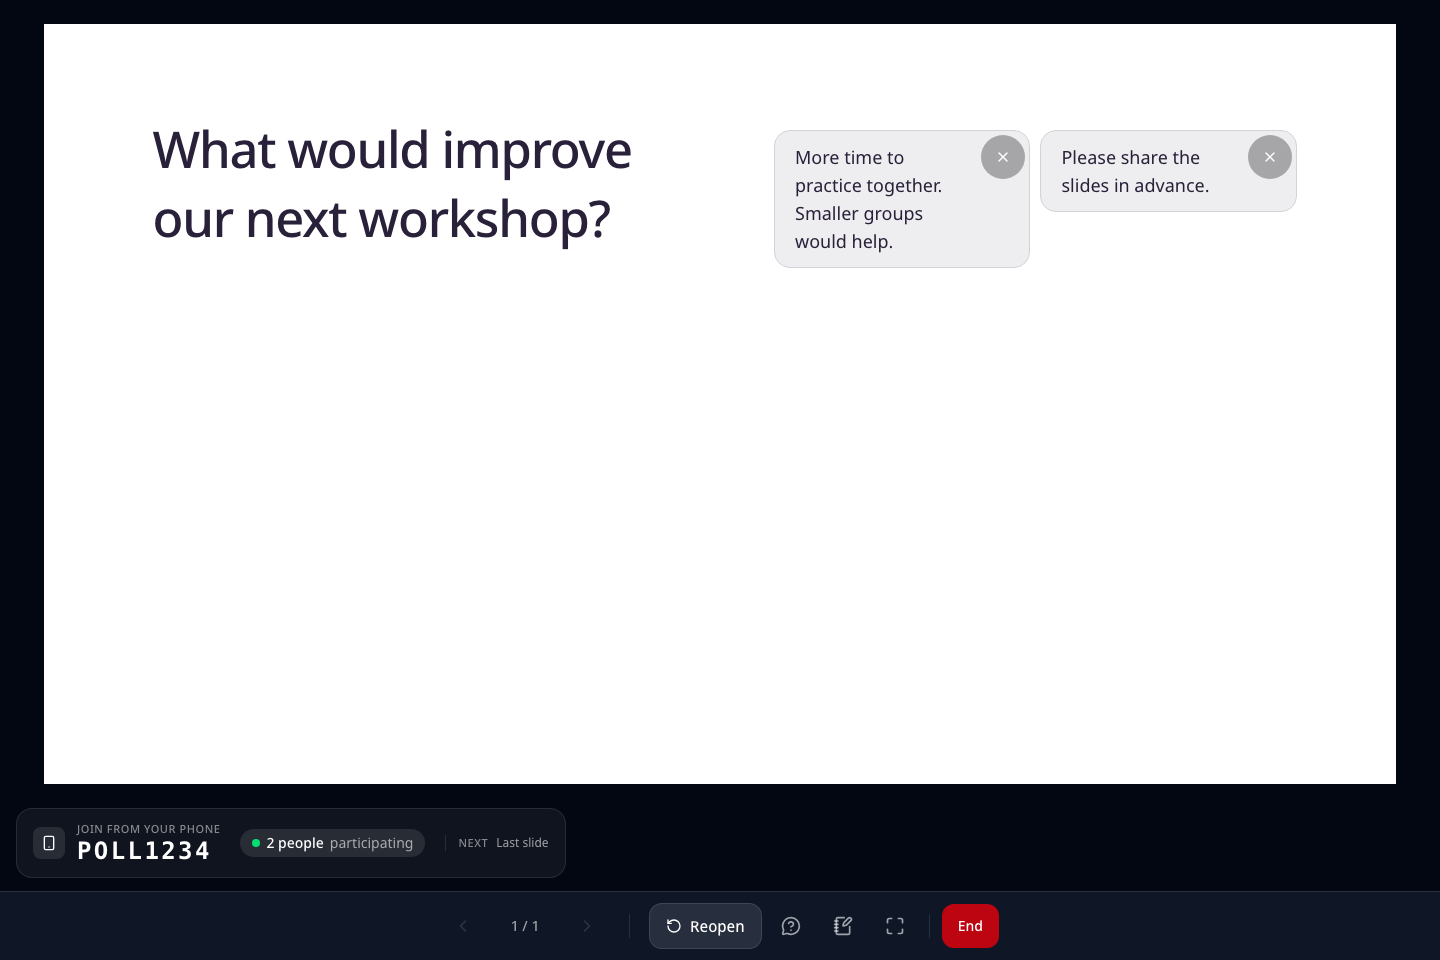
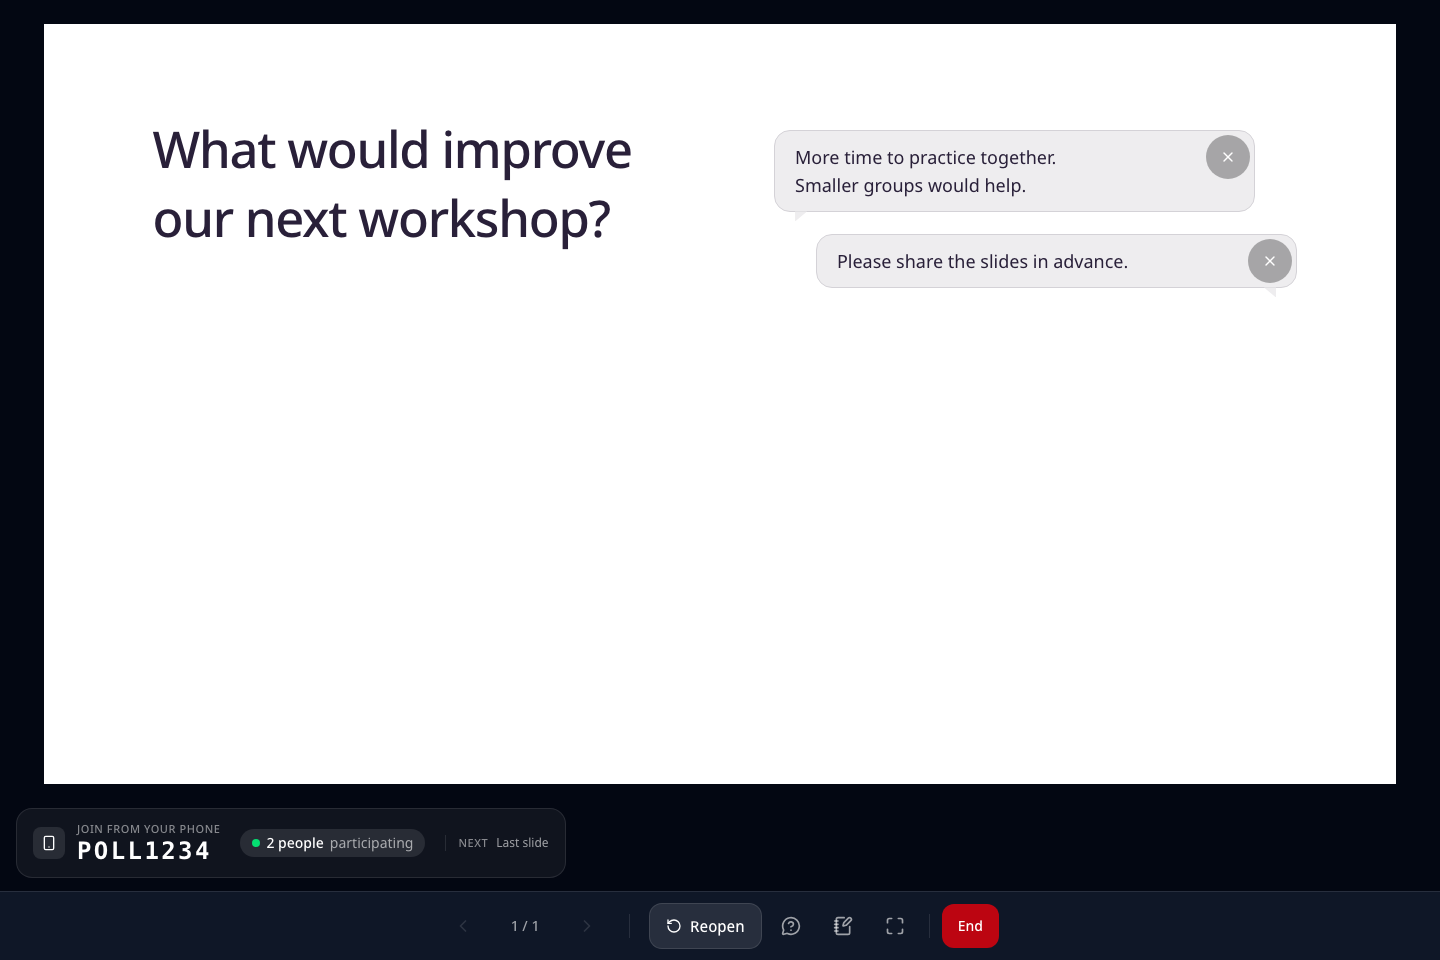
Long answers wrap; scroll within the results area to read more. Select Hide answer beside the answer. The button is always visible and works with keyboard and touch. Confirm that the answer disappears. It also disappears from other presenter screens for the same presentation, such as the PowerPoint results view. If hiding fails, the answer returns to its original position with the message Could not hide the answer. Check your connection and try again. Check your connection, then select Hide answer again.
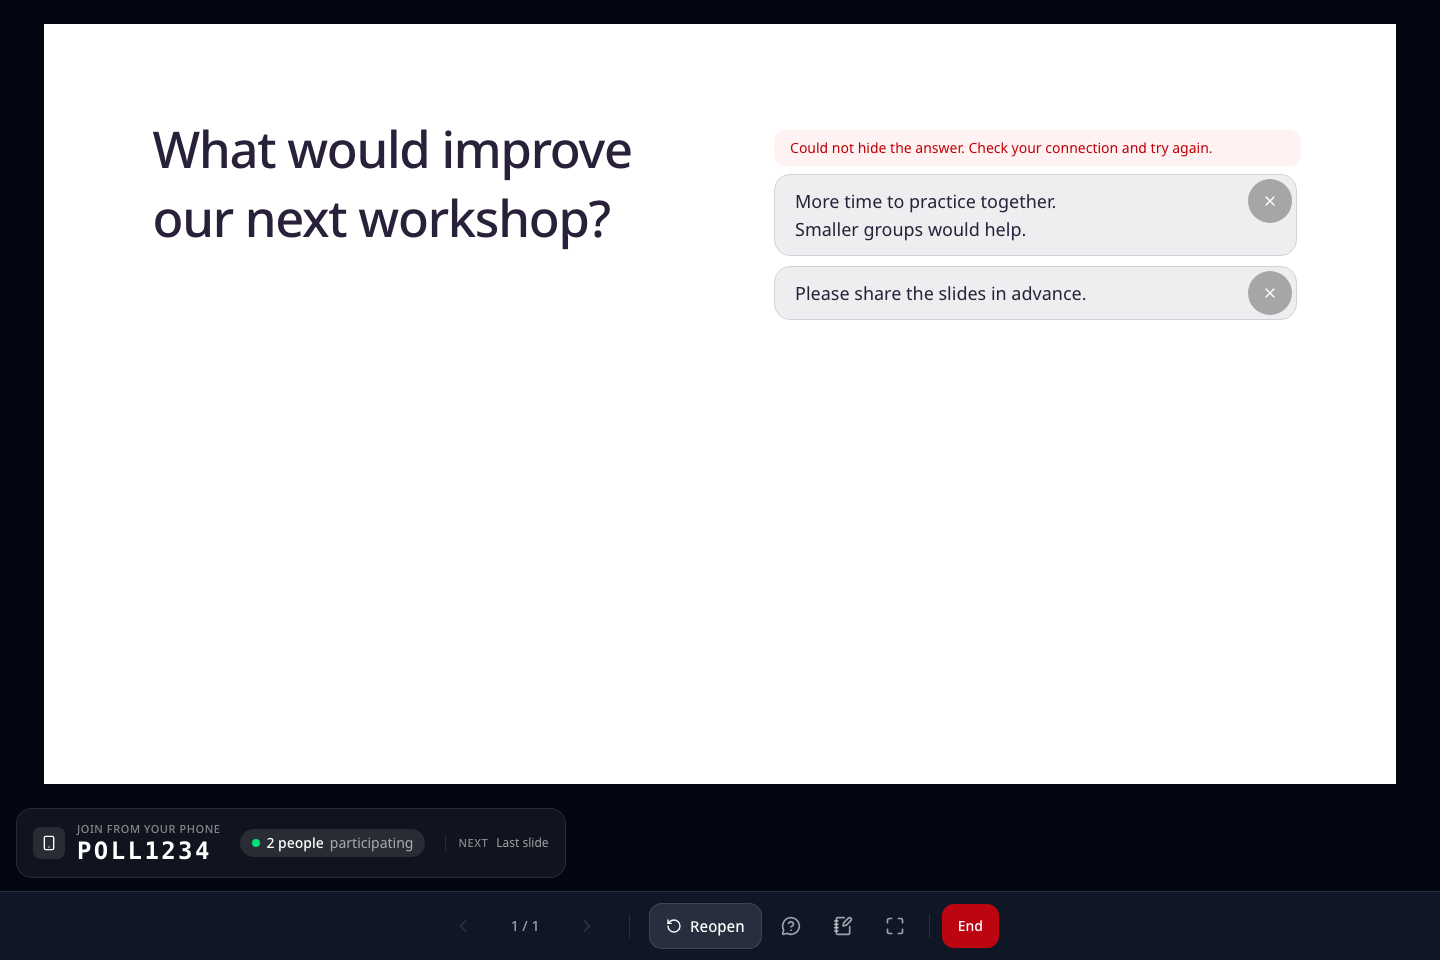
If the presentation screen briefly loses its connection, answers received in the meantime reload automatically after it reconnects. Answers are not shown twice, and hidden answers do not come back. Brainstorm boards continue to use their dedicated upvote view.
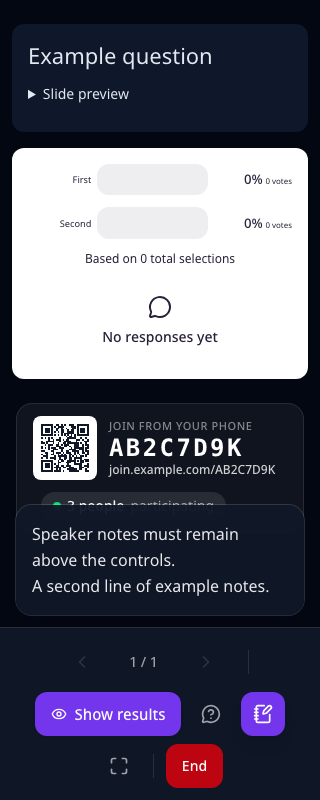
Open Speaker notes to read notes above the bottom controls. Their position follows the control bar when it wraps on a narrow screen. Scroll inside the notes area to read longer notes.