Results and reports
Choose a session, read its question results, export CSV when your access permits, and share aggregated results with a link.
1. Check access before opening a report
Sign in with the account that owns the presentation. Collaborators can view session history, but detailed reports require ownership. Editing permission does not automatically grant access to detailed results. CSV export also requires a separate feature entitlement.
There are no session records until you start an actual presentation. Test answers in the editor preview do not create live session responses.
2. Open session history from the workspace
Select the chart icon with the Presentation report tooltip for a presentation in the workspace. Its session list shows start times, end status, and participant counts. Immediately after ending a presentation, you go directly to that session's detailed report.
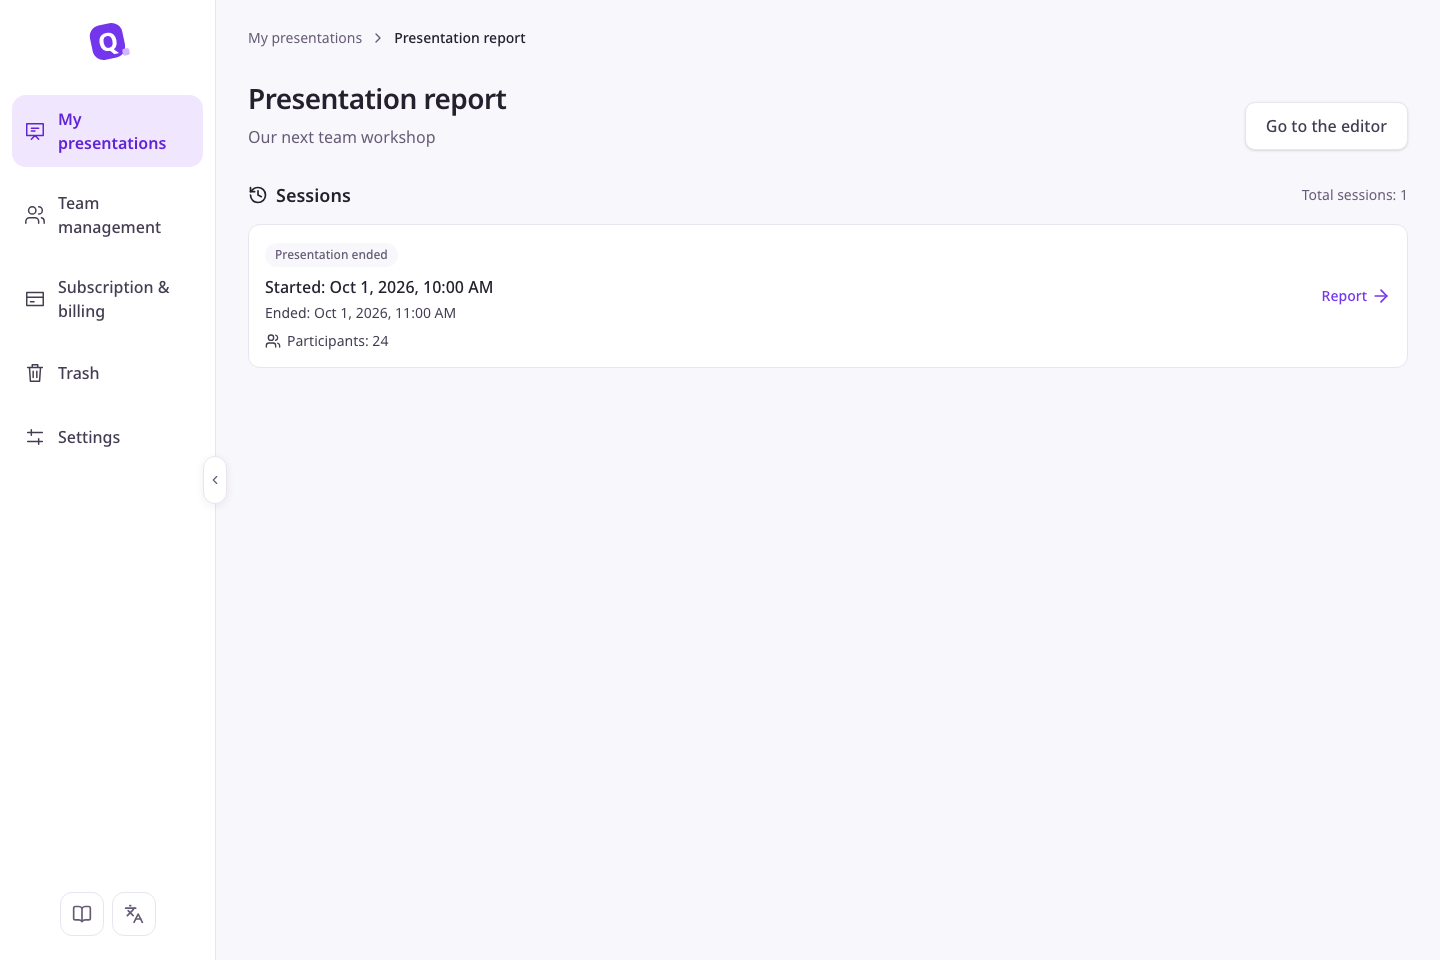
Each list item represents one presentation session. Read its active or ended status together with its time. Use the previous and next controls below the list when there are multiple pages.
To return to your presentations, select My presentations in the breadcrumb at the top. Select Go to the editor to edit the presentation.
3. Distinguish rehearsal and event sessions
Select a session to open its results. The same presentation can have different participants and answers in each session; the detail view is not an aggregate of all sessions.
A rehearsal using the real join link leaves records. Use start and end times to identify your event. Reopening an active presentation can resume the same session, so the number of times you opened the screen is not necessarily the number of sessions.
4. Read participant counts and question results
At the top of the detail view, check the presentation name, end status, and participant count. In the question results, read each slide's title, type, response count, and available breakdown.
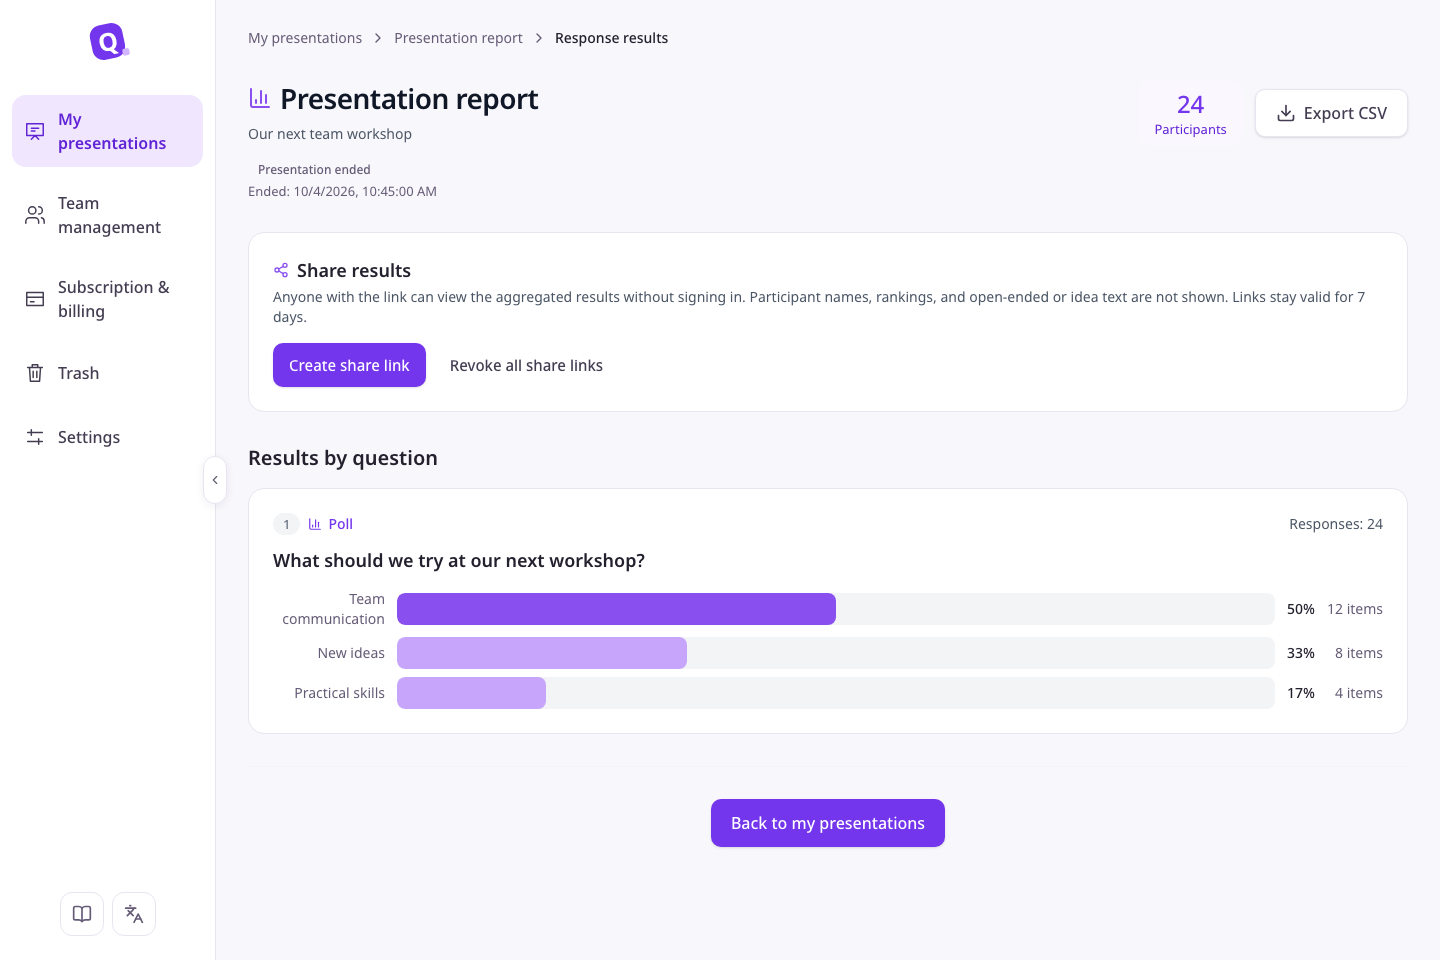
The summary describes the selected session; the cards below show results for individual questions. Do not assume every question has as many responses as the session has participants. Some participants may not have answered.
| Result type | What to read |
|---|---|
| Choice question | Review the option counts. A multiple-choice poll can let one participant select several options. |
| Text question | Read submitted text. Surveys can include separate text and choice results for their questions. |
| Rankings and ideas | Review ranking aggregates or ideas ordered by upvotes. |
| Scored question | Review scores and the leaderboard. Not every slide produces scores. |
5. Review an active session
An active presentation can show results as of the time you opened the report. The detail page does not automatically refresh whenever a new answer arrives. Refresh it to see newer responses.
Use the presentation view to run the session and control responses. Simply viewing a report does not end the presentation or close responses.
6. Export a CSV
- Open the detail report for the session you want.
- Select Export CSV. If an access-conditions or availability button appears instead, open that guidance first. If checking permissions failed, select Check again.
- Wait while Preparing CSV… is displayed.
- When the download-started message appears, check your browser's downloads list.
If preparation fails, select Retry CSV export. A download-started message does not confirm that the browser finished saving the file; check the downloads list as well. This action exports CSV, rather than a PDF report or PowerPoint file.
7. Resolve empty results and loading errors
| Situation | What to do |
|---|---|
| No sessions yet | Check whether you only used the editor preview, then start an actual presentation session. |
| Expected responses are missing | Check the presentation and session time. Refresh if the session is active. |
| A slide has no answers | Check whether it actually collected responses. Content slides may not accept answers. |
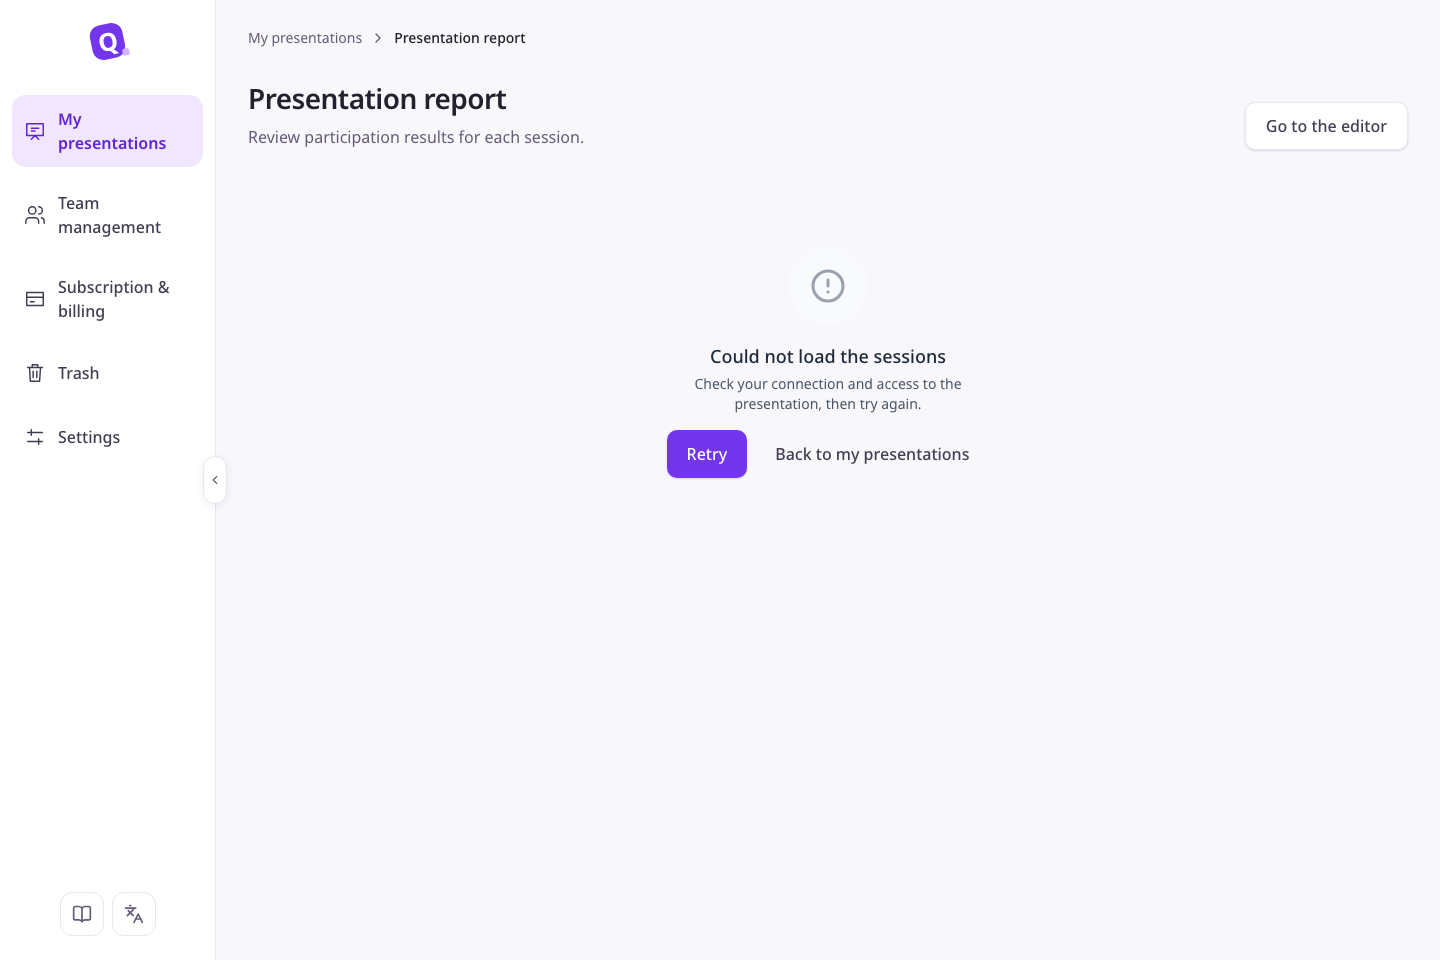
| History or detail fails to load | Check your signed-in account, ownership, and connection, then use the retry action. |
| CSV preparation fails | Check your connection and export access, then try exporting again. |
If session history fails to load, select Retry directly below the error guidance. To leave, use Back to my presentations in the same action group. When there are no sessions yet, Prepare a presentation and the return action also appear below the guidance.
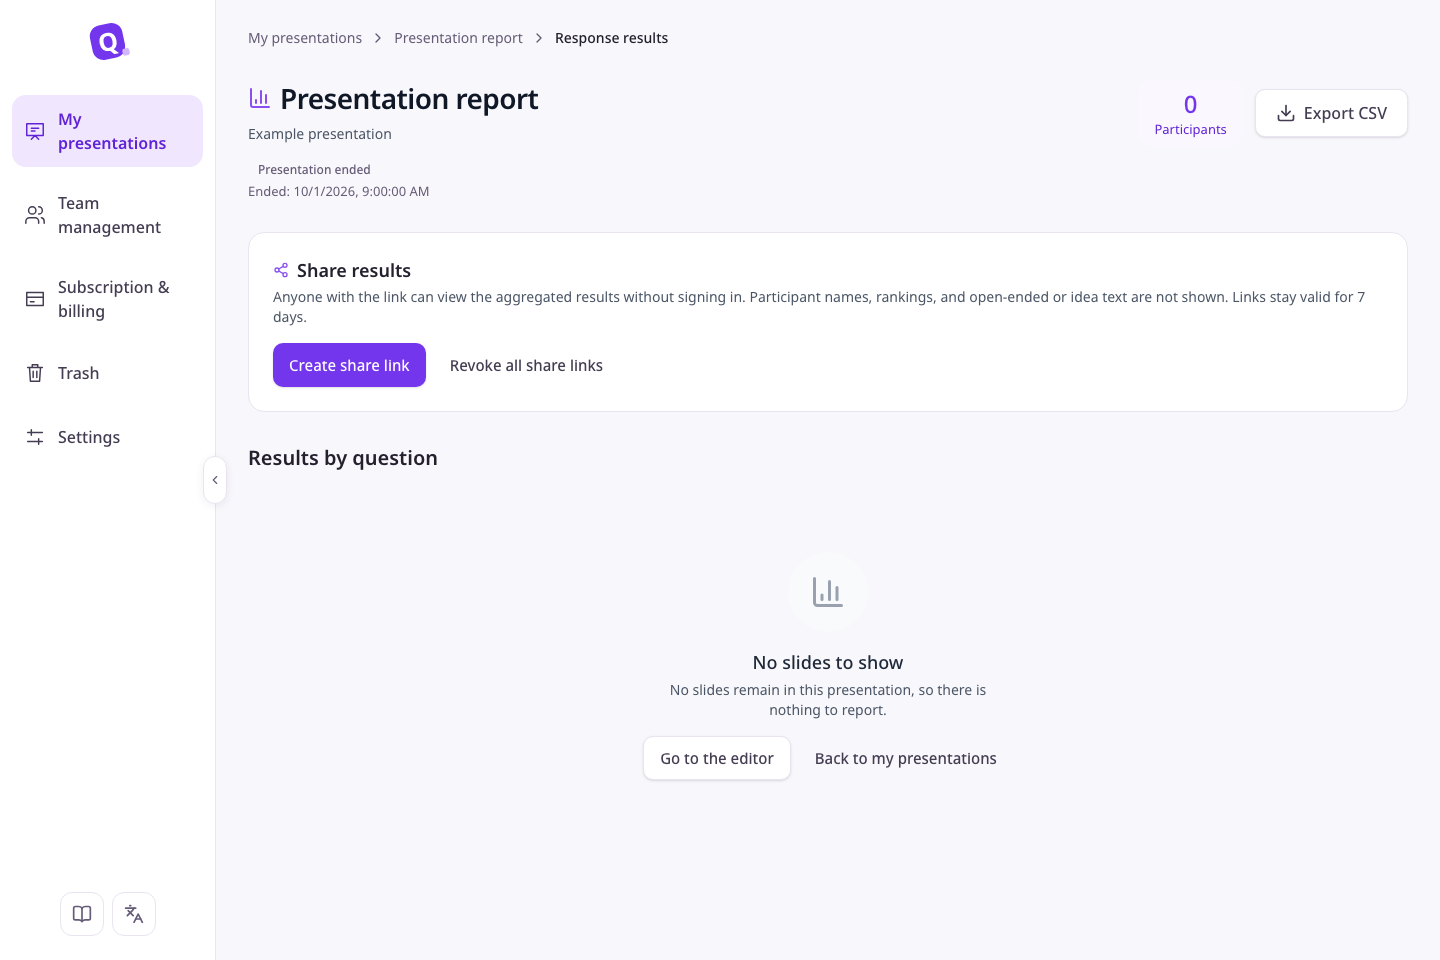
If No slides to show appears, use Go to the editor to check the remaining slides or Back to my presentations to open the list.
If the problem continues, note the presentation name, session time, and displayed error when contacting support. Do not send passwords or verification codes.
8. Review the exported file before sharing
A CSV can include answer content, participant names, and emails when email verification was used. Open the file and review its contents and intended recipients before sharing. Share only what is needed, and keep rehearsal data distinct from event results.
9. Share aggregated results with a link
Use a share link to show results to people without a SlideQ account. Only the presentation owner can create share links, and each session has its own links.
- Open the detail report for the session you want to share.
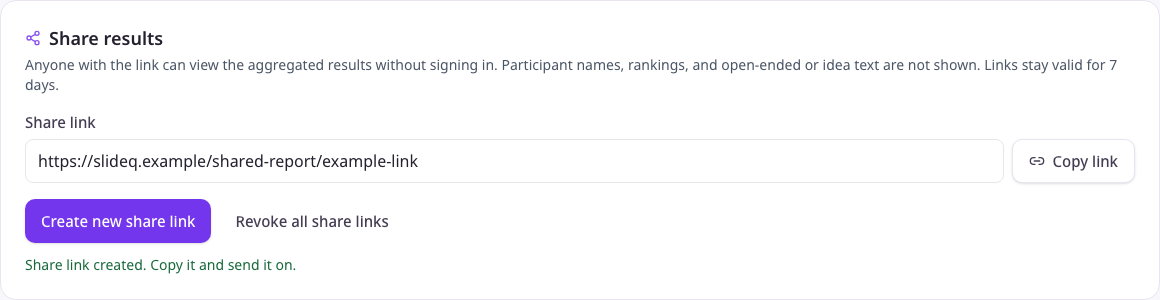
- In Share results, select Create share link.
- When an address in the form
https://…/shared-report/…appears in Share link, select Copy link and send it by email or chat. If copying fails, select the link field and copy it yourself.
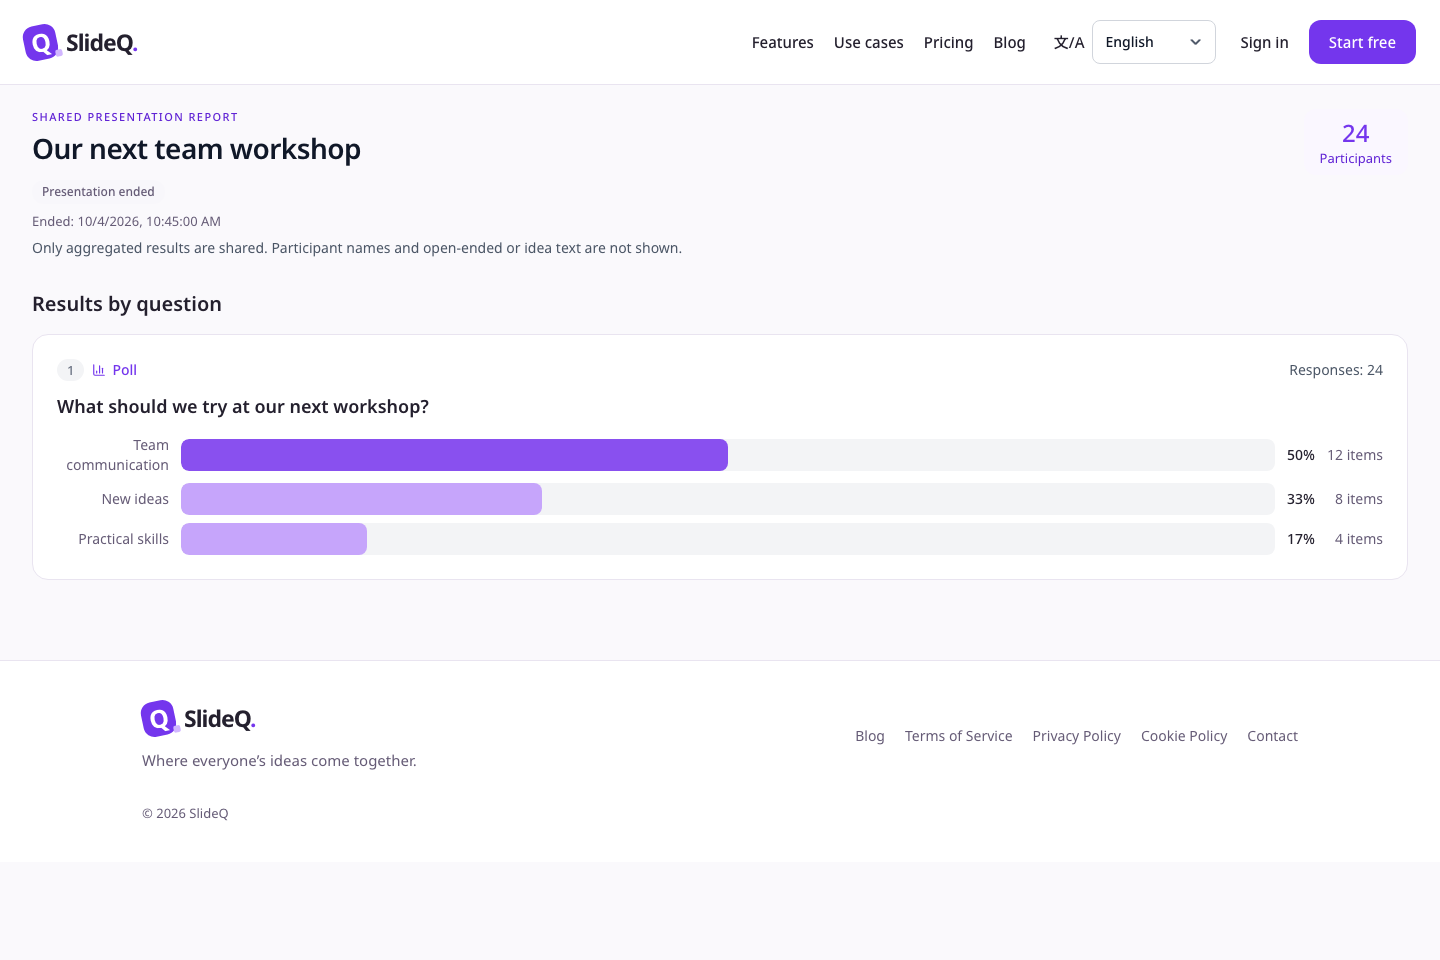
Recipients see the presentation name, participant count and per-question aggregates without signing in. Participant names, leaderboard rankings, open-ended, word cloud and survey text answers, and idea text are not shown. Slide titles and option labels do appear as written, so check titles for sensitive content first. Sharing an active session shows results as of when the link is opened.
A link opens for 7 days from creation. After that, create a new one with Create new share link. Creating a new link does not cancel earlier links; they keep working until they expire.
To stop showing results, select Revoke all share links, read the confirmation, then select Revoke all. Every link created so far for that session stops opening; only links created afterwards work. You cannot revoke a single link on its own.
| Situation | What to do |
|---|---|
| Recipient sees This share link can’t be opened | The link is older than 7 days or was revoked. The presenter creates a new link and sends it again. |
| Couldn’t create a share link | Check that you are signed in as the owner and that you are connected, then try again shortly. |
| Recipient sees Could not load the report | This may be a connection problem. The recipient selects Retry. |
Compare Pulse measurement rounds
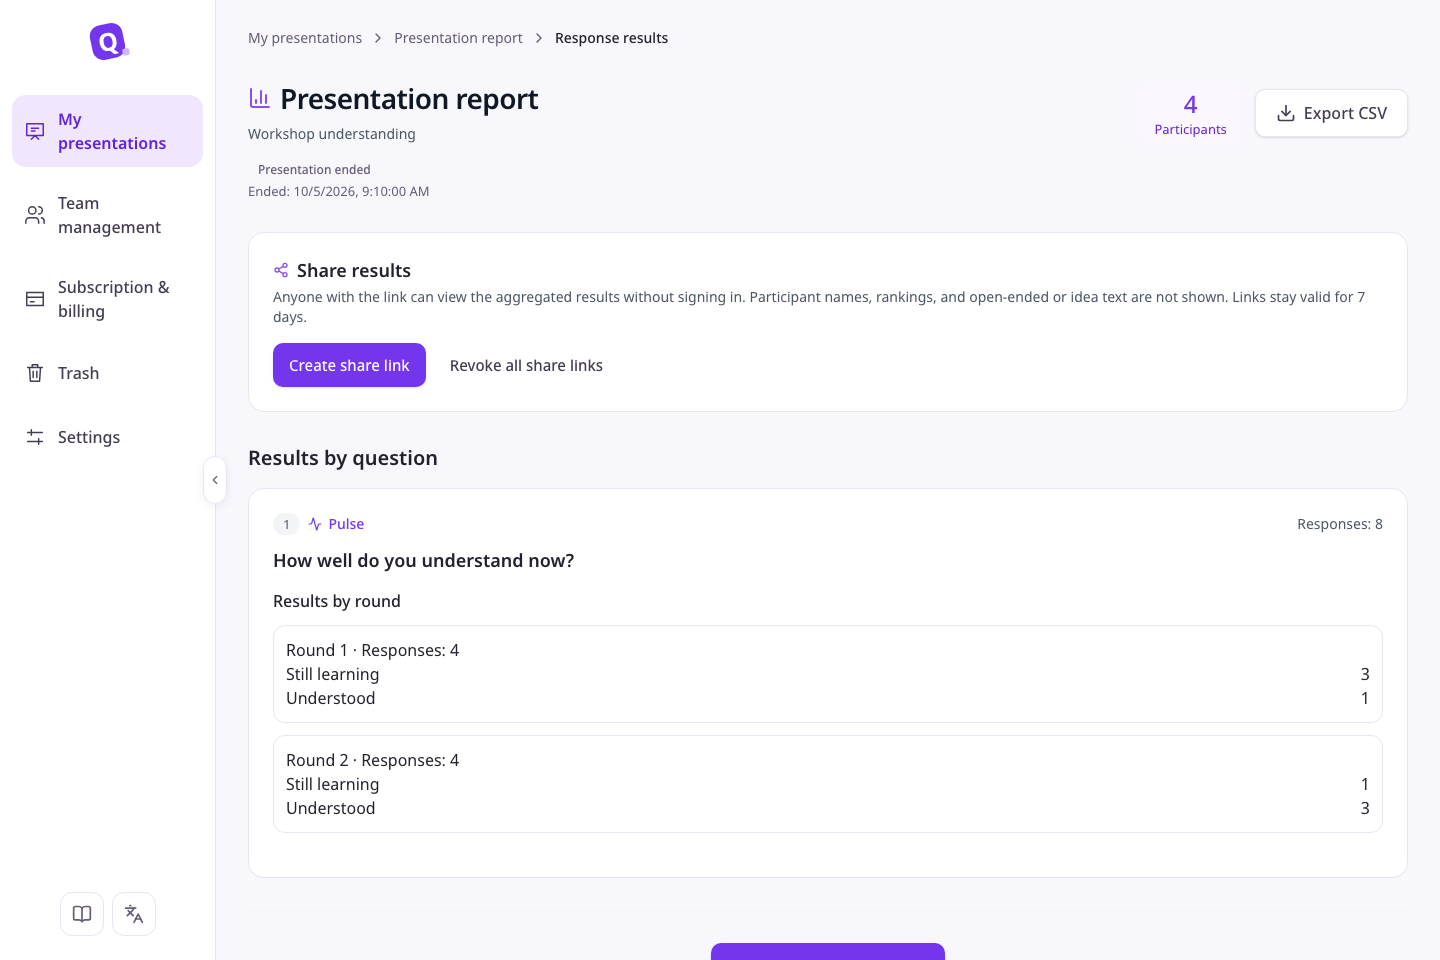
Under a Pulse question, Results by round shows each round number, response count, and votes per option. If the same four people answer twice, there are eight responses overall and four in each round. These are actual measurement rounds created with Next round, not time buckets based on when answers arrived. Empty rounds show zero responses.
The Pulse round column in CSV identifies each measurement of the same question. It is blank for other question types; existing columns retain their order. Pulse responses saved before rounds were introduced are preserved in the first round. Unrecorded historical rounds are not inferred.
Read structured response details
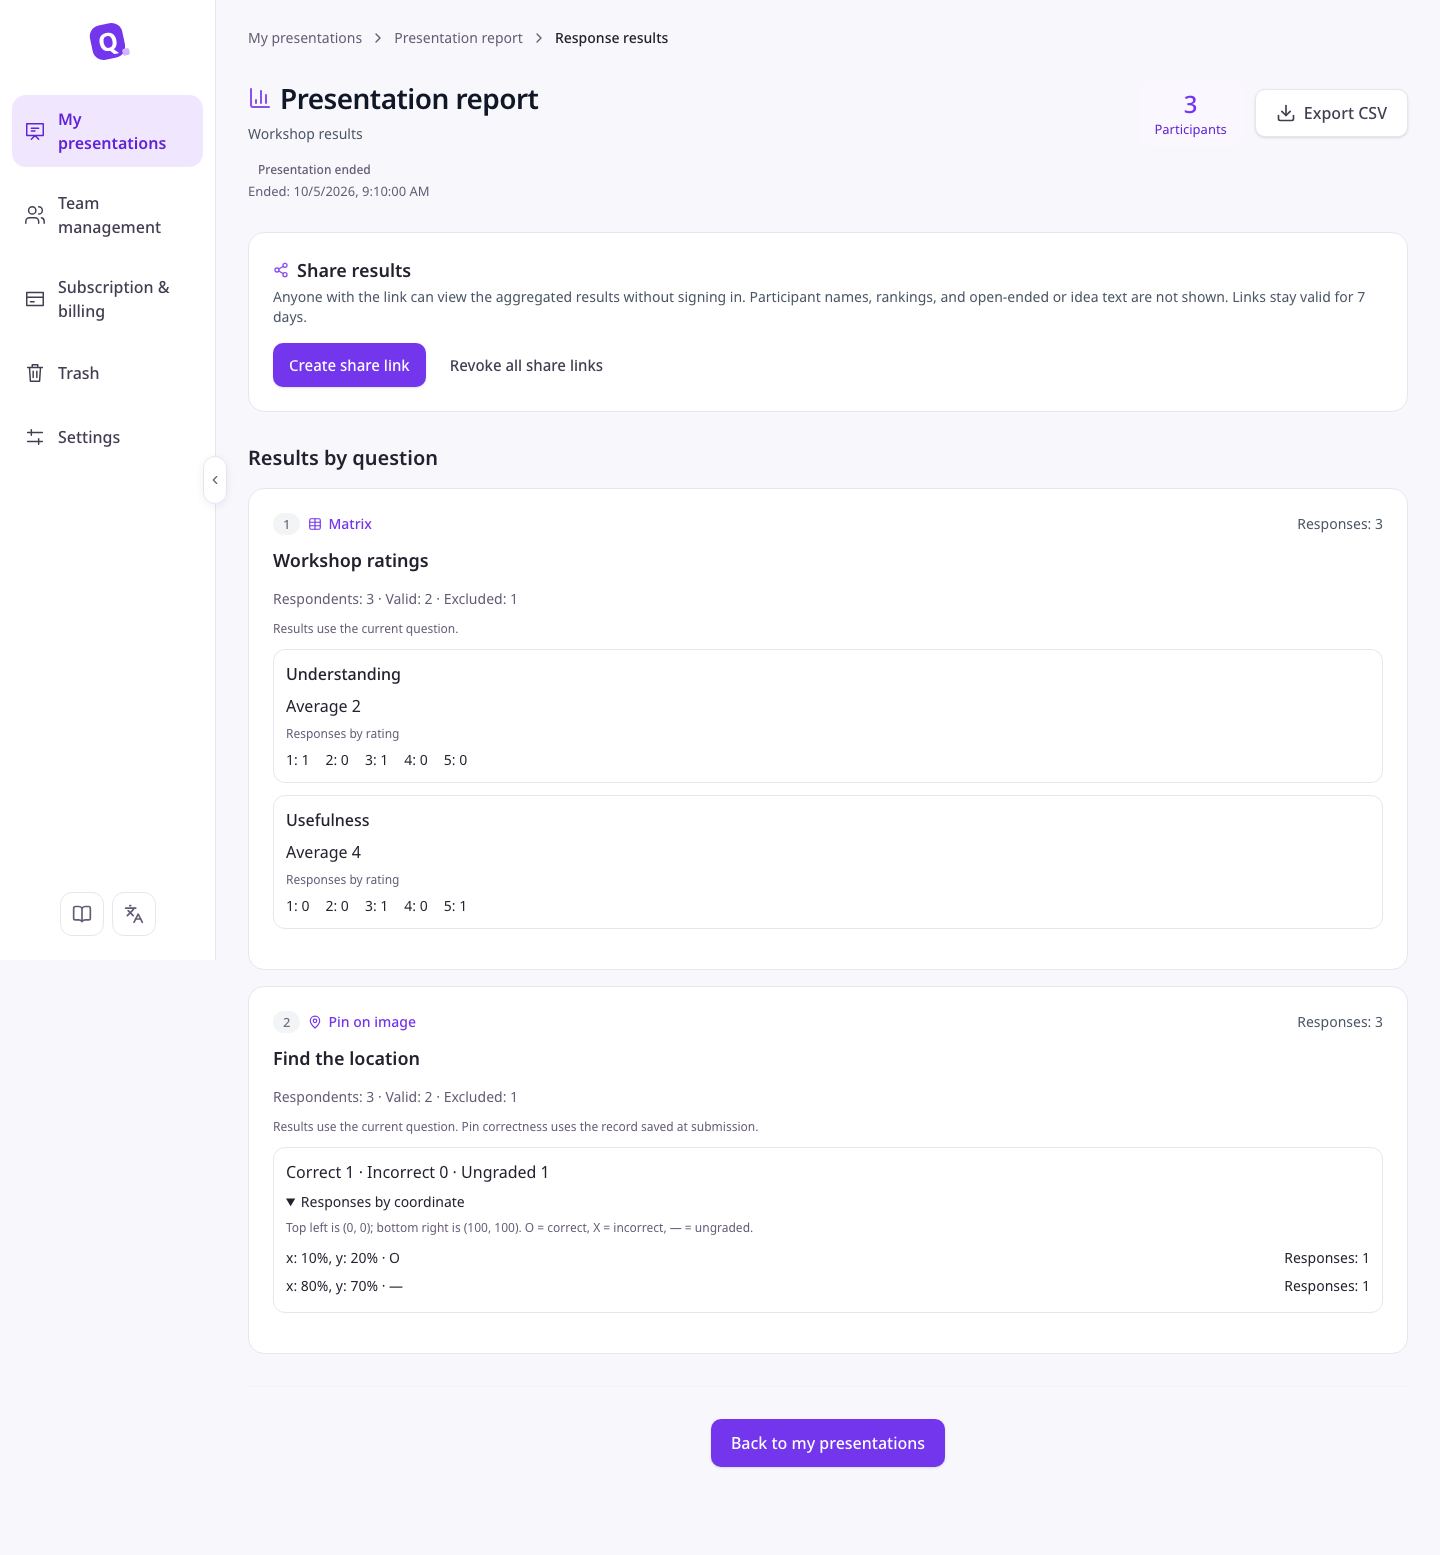
Open a session report and find the question under Results by question. The following five types show the number of respondents and Valid and Excluded responses. Respondents counts people who answered that question; valid responses counts the records used for averages and rates. People who did not answer are not included in the denominator.
| Type | What the results mean |
|---|---|
| Matrix | Each statement's average and response count at each rating. 1: 2 means two responses selected a rating of 1. One rating of 1 and one of 3 give an average of 2. |
| Pin on image | Correct, incorrect and ungraded counts. Open Responses by coordinate to see percentage coordinates from top left (0, 0) to bottom right (100, 100), with response counts. Correctness is the record saved at submission; changing the answer area does not regrade it. |
| Match pairs | For each currently configured pair, the number and percentage of matches and counts by selected right-hand label. Matched 1/2 (50%) means one of two valid responses matched that pair. This does not award new game points. |
| Categorise | The number of assignments to each category for each item. This is a distribution, not a correctness rate or game score. |
| 100-point allocation | Each item's total and average per valid response. Allocations of 25 and 75 give a total of 100 and an average of 50. Included records have integer allocations from 0 to 100 that add up to 100. New submissions reject fractional values and incorrect totals. Older records with rounding discrepancies remain unchanged in the excluded count and raw CSV. |
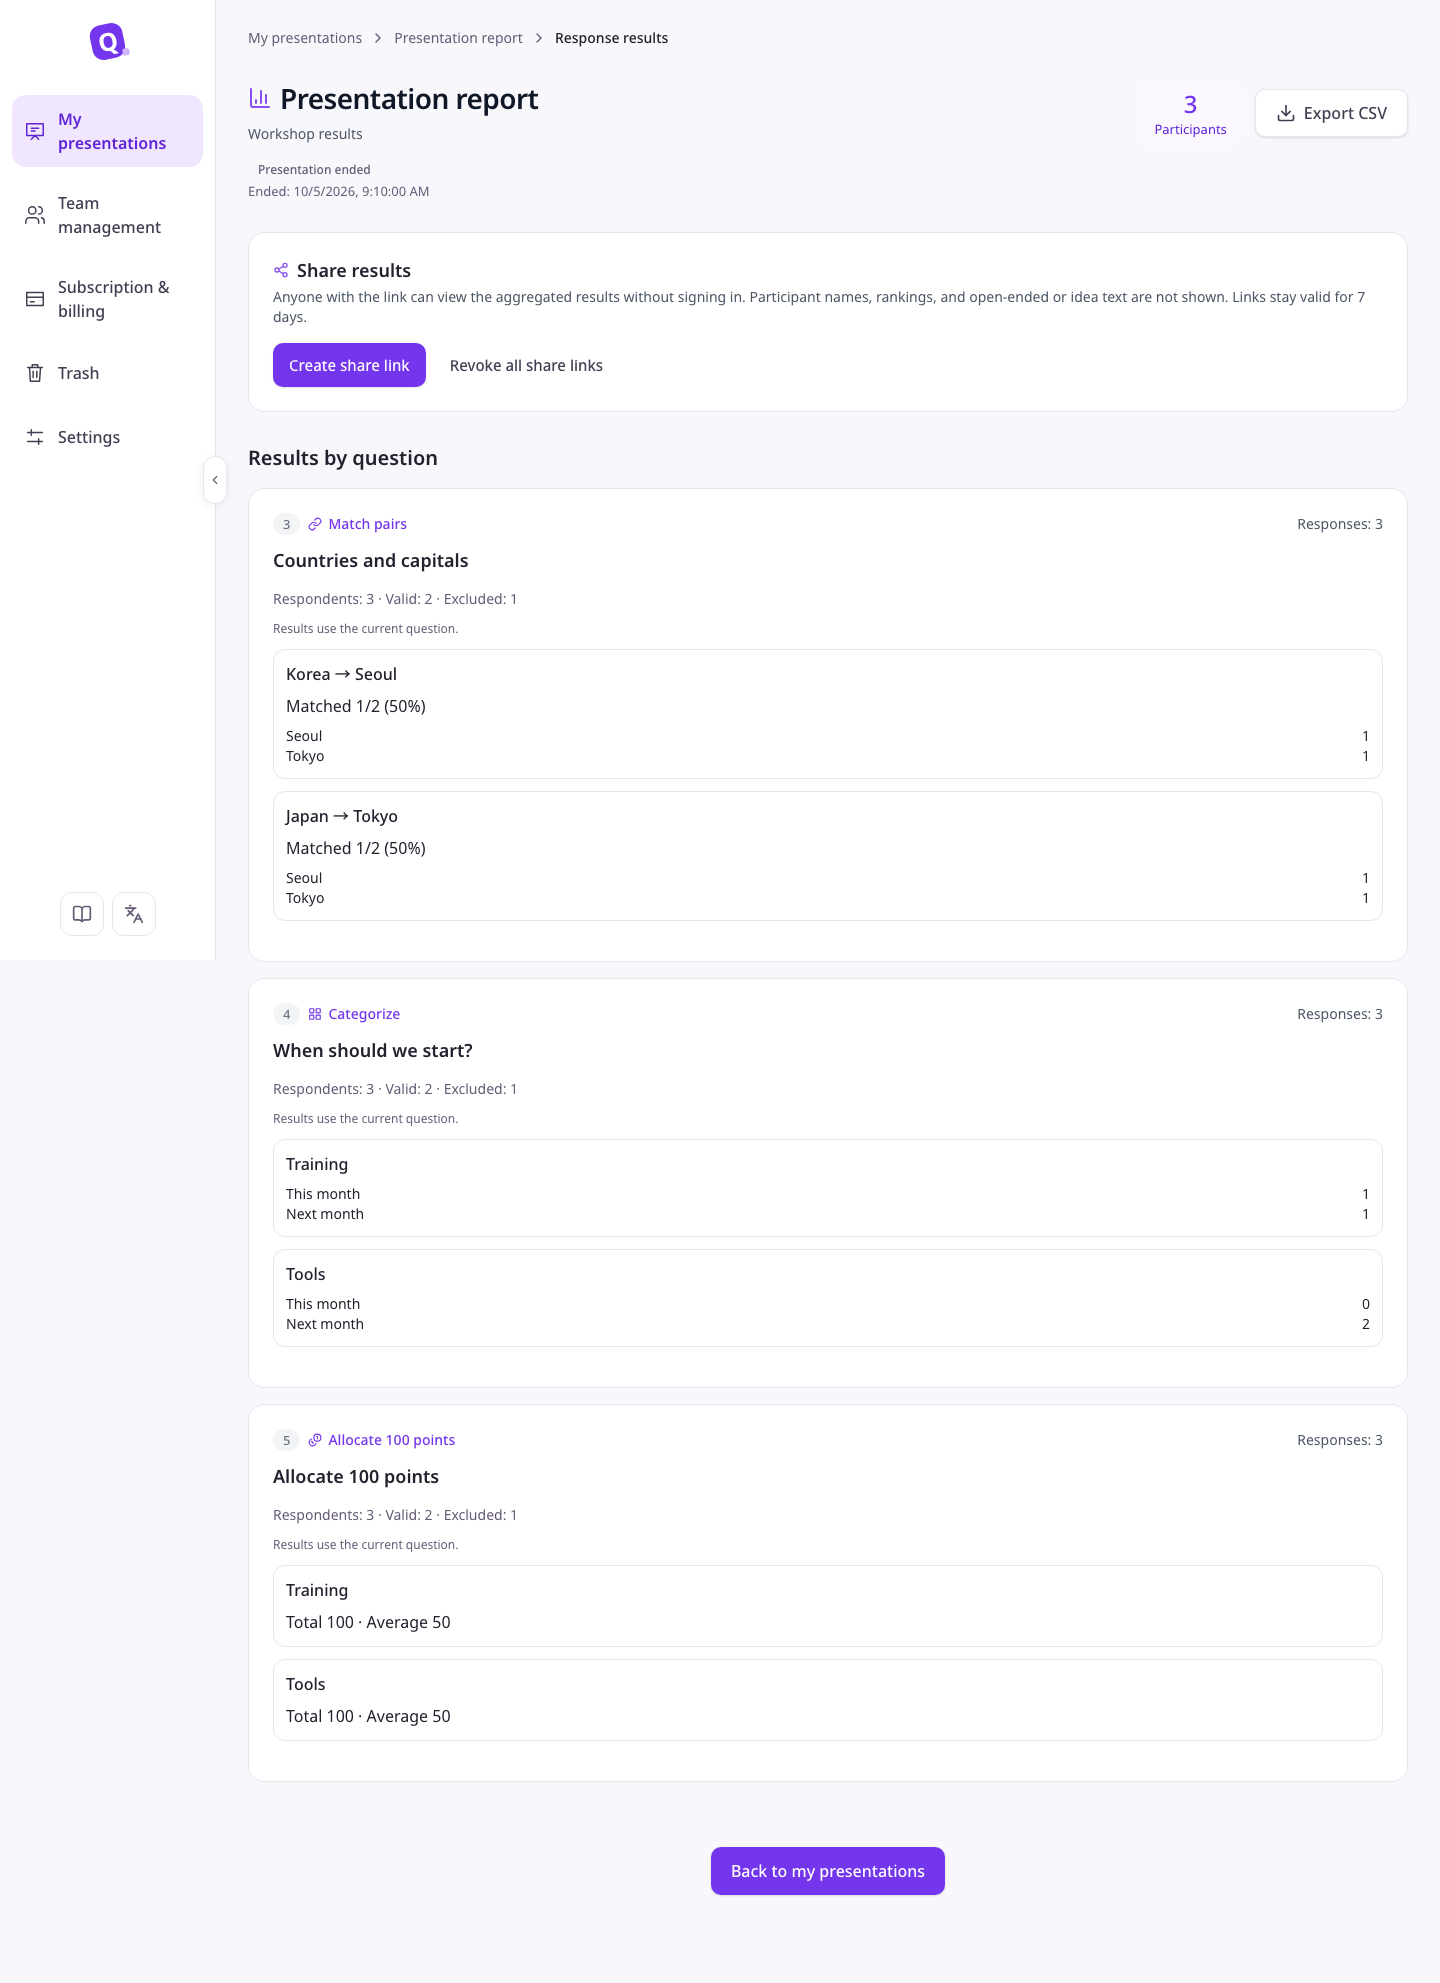
An average appears as — when there are no valid responses. Records with malformed JSON, missing required values or references to items or categories absent from the current question are Excluded in full. They are not partly counted or converted to zero. If the excluded count is unexpected, check whether the question's items, labels or scale changed, then inspect the raw values in the CSV.
These five types resolve labels and pairings using the current question. They do not restore past wording or answer-key revisions. Pins retain submission-time correctness, and Pulse separately preserves labels for each round.
CSV keeps the raw JSON in Option/value and the existing column order, then appends Answer details (current question) as the last column. For example, {"a":25,"b":75} is accompanied by Training: 25 and Tools: 75 on separate lines. Pin correctness remains in the existing Correct column. Unreadable records and other slide types have an empty details column while retaining the original value. After downloading, compare these two columns in the relevant row to verify the export.
Review scale results
Open a session report and find the scale question. It shows the current range, three labels, response counts by value, average, unique respondents and valid/excluded counts. In the example below, 0 and 6 are two valid answers with an average of 3; one earlier answer outside the current 0–8 range is excluded.
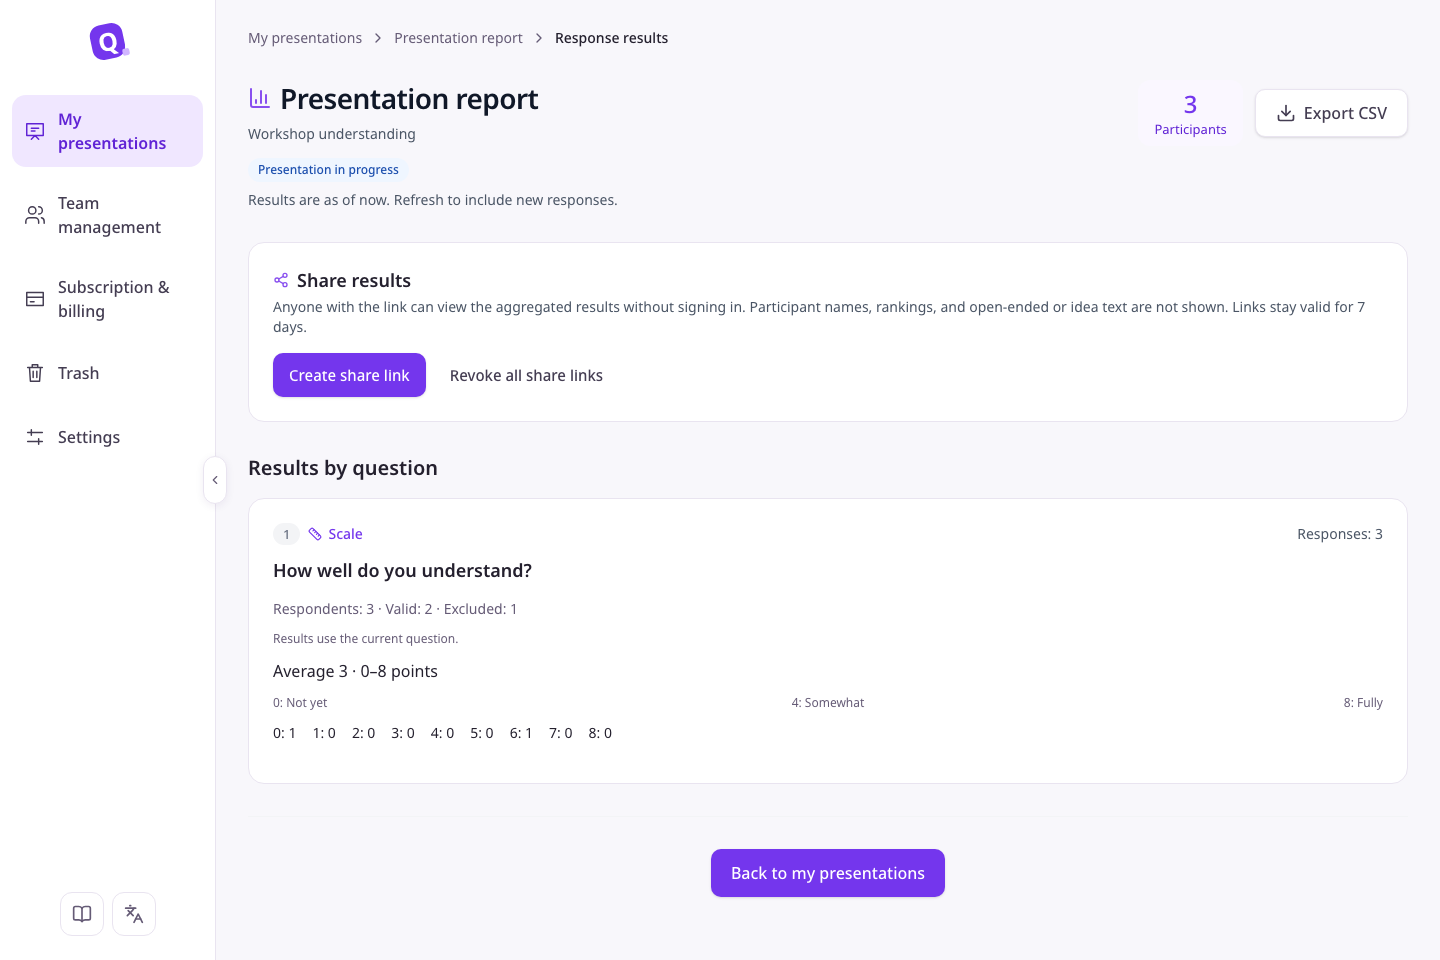
Non-numeric, fractional and out-of-range answers are excluded from the average and distribution. With no valid answers, the average is —. If results seem unexpected, check for range changes and download the CSV to compare the original Option/value entries. Excluded values remain unchanged in the CSV. The displayed range and labels are current settings, not a snapshot of the settings when each answer was submitted.